Cohort Retention Analysis
This document explains how to use Retention analysis in the Moesif’s User and Company Analytics suite.
Moesif supports Retention analysis for both Users and Companies. Unless this document states explicitly, it uses the term user to represent both Users and Companies for simplicity.
Overview
The Retention analysis allows you to accurately measure product retention and stickiness over time. Product retention measures the percent of users within a cohort that interact with your API in some way and then return to continue interacting with your API. This contrasts with subscription retention that merely tracks whether a customer has an active subscription. Product retention, on the other hand, tracks whether users come back and actively use your product.
If you’re not familiar with retention analysis, see the third chapter of API Analytics: The Ultimate Guide to Grow Your Platform Business eBook
To start a Retention analysis, you need to decide on initial and returning criteria in the First Event and Returning Event fields respectively. By default, Moesif considers any activity, but you can specify your criteria based on API events or custom actions.
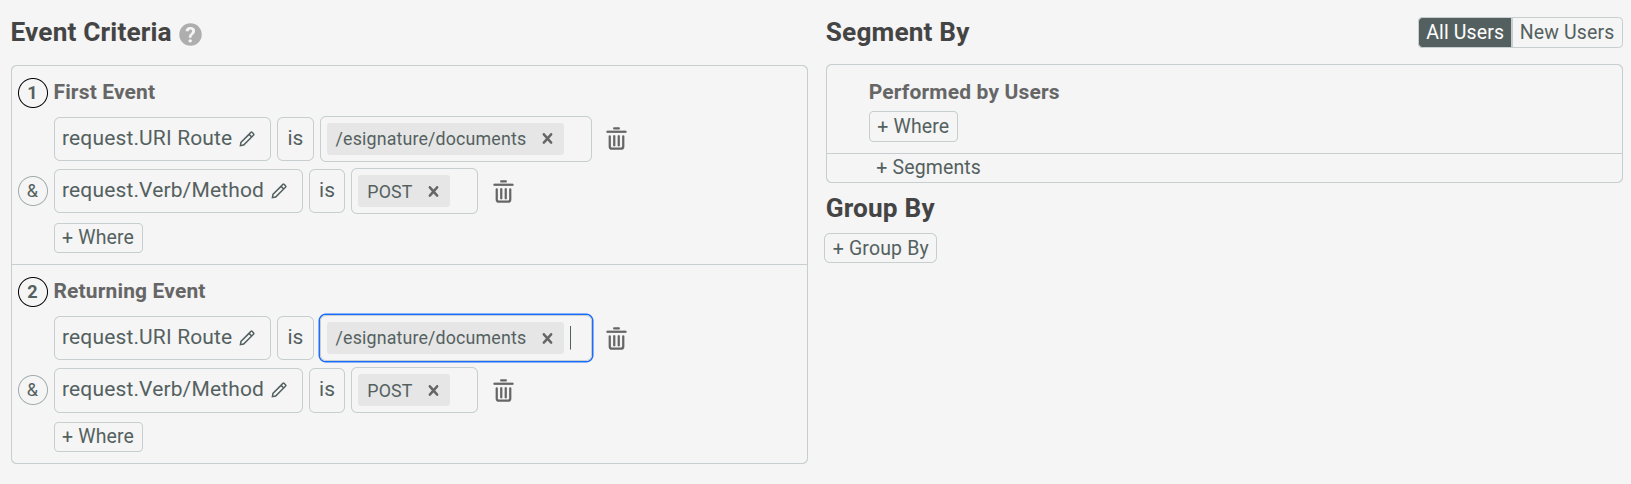
For example, consider an electronic signature API. Then you can set the following criteria:
- First event criteria
POSTrequest to the/esignature/documentsendpoint.- Returning event criteria
POSTrequest to the/esignature/documentsendpoint.
Before You Start
Events may take up to 20 minutes to show up in the user analytics screens. If your data has not appeared, make sure you wait until Moesif has completed the instrumentation process and loaded the data.
Create a Simple Retention Analysis
You can create a new Retention analysis in two ways:
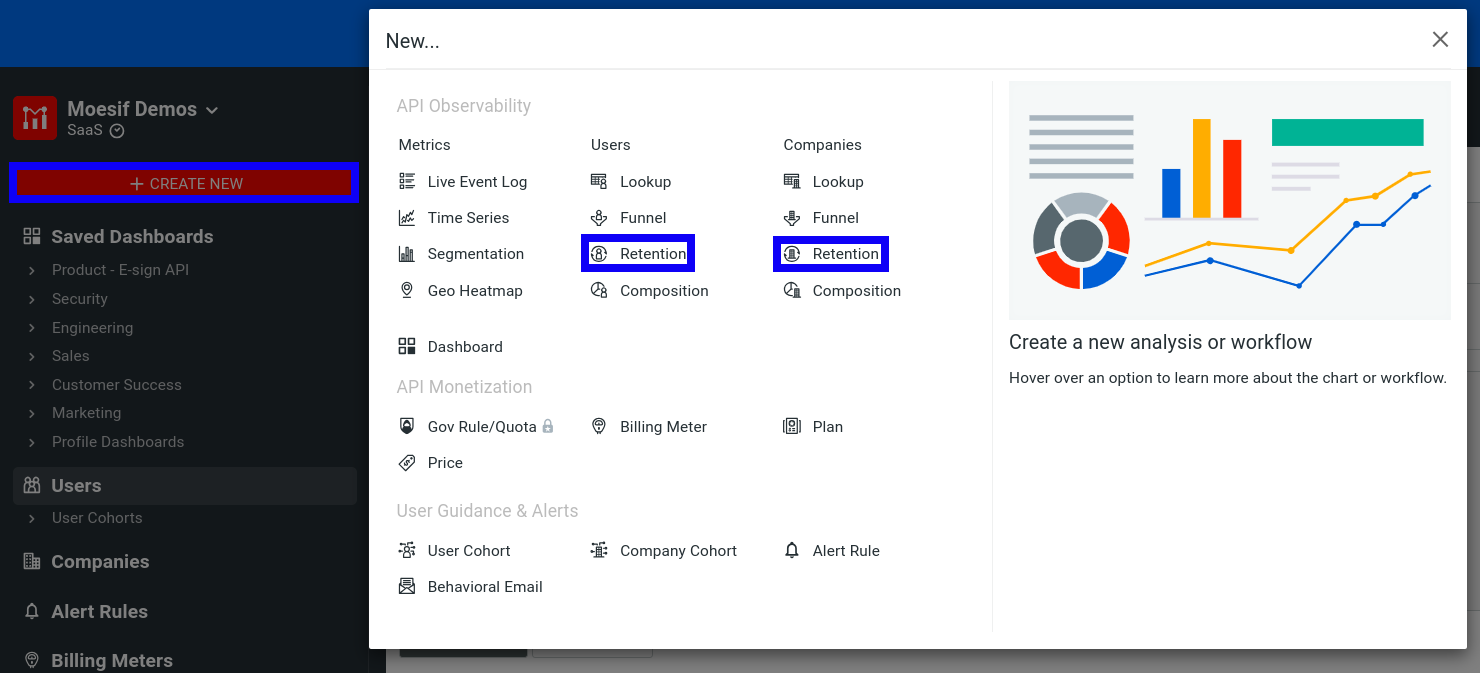
Use the Create New Dialog
- Log into Moesif Portal.
- Select + Create New in the navigation menu.
- Select Retention for Users or Companies.
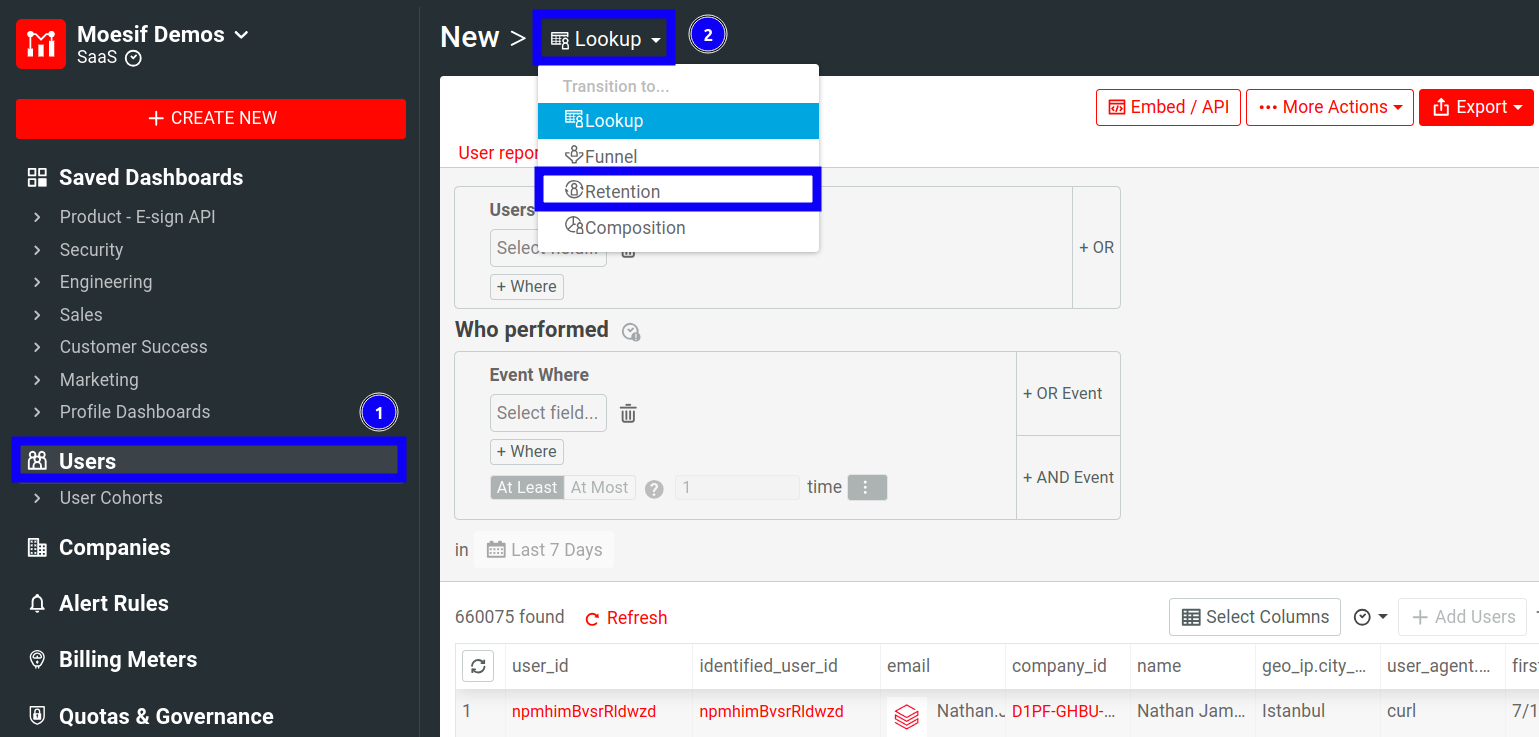
Use Users or Companies Screen
- Log into Moesif Portal.
- Select Users or Companies in the navigation menu.
- Select Retention from the dropdown menu.
Next, specify the first and returning events criteria. For example, here we create a simple retention analysis where we want to understand company retention by different subscription plans over the past month.
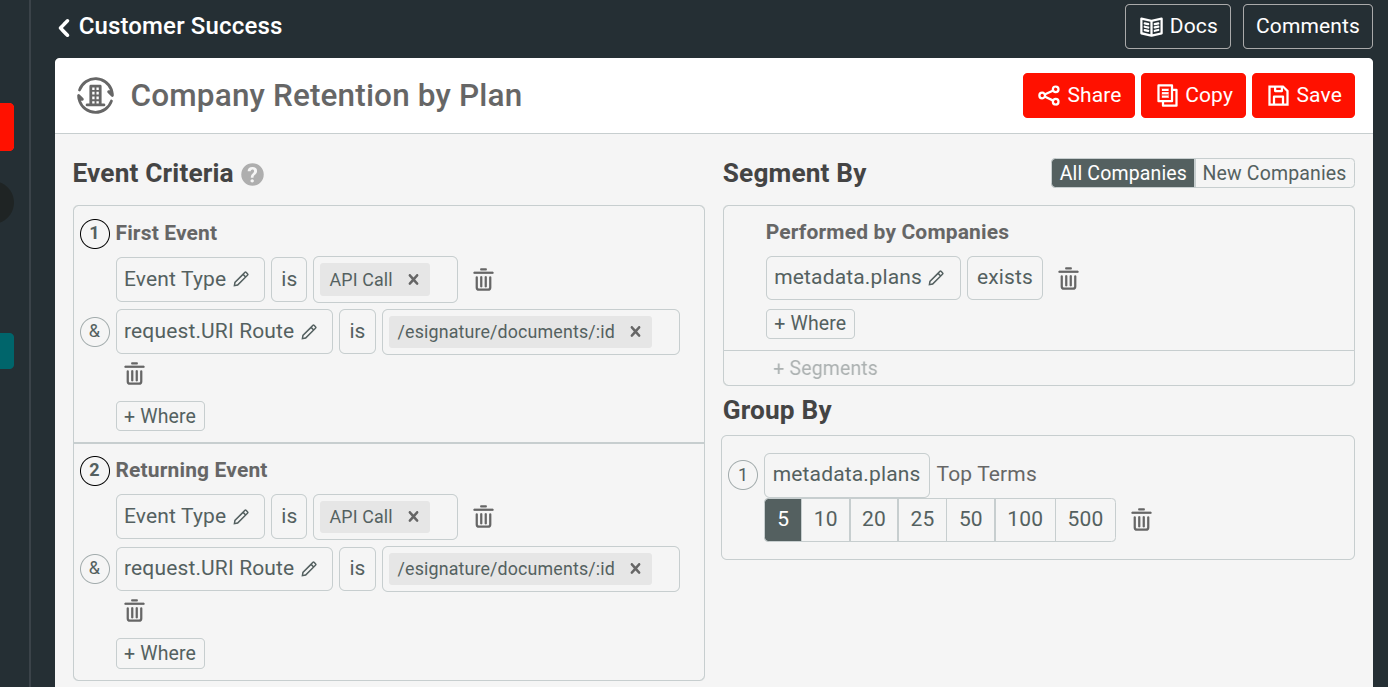
If you don’t specify the First and Returning events, Moesif calculates the retention based on any event Moesif receives for that user. This can sometimes prove useful but to accurately analyze customer retention, we recommend picking specific first and returning events.
Filters
In a Retention analysis, you must define how you consider customer retention for your use case. In Moesif, this means specifying a pair of events using event filters. You can further refine your analysis with groups and segmentations.
The next sections discuss how to define the retention events and make use of the powerful filters available to you.
For more information about the available filters in Funnel analysis, see Reference: Analytics Filters.
Determining First Event and Returning Events
Creating a retention analysis requires you to define two events. These two events define when you consider a customer retained.
Define the initial event in the First Event pane. The initial event represents when a user first receives value from the product. For example, on an e-commerce platform, this may capture the first time the user actually creates a purchase order. For a communications platform, the event may capture a user sending a text message through the platform.
Lastly, define the second event in the Returning Event pane. The returning event indicates when a customer returns back to the platform and performs an event where they receive value from the product. This means the customer has become a repeat custome or buyer. Typically, you define the same type of event as the initial event and the returning event, but it may be something completely different. Every time a user performs the returning event they Moesif considers them a retained customer. When a user no longer performs the returning event, the user is no longer retained and likely is no longer using the product.
Setting the Event Criteria
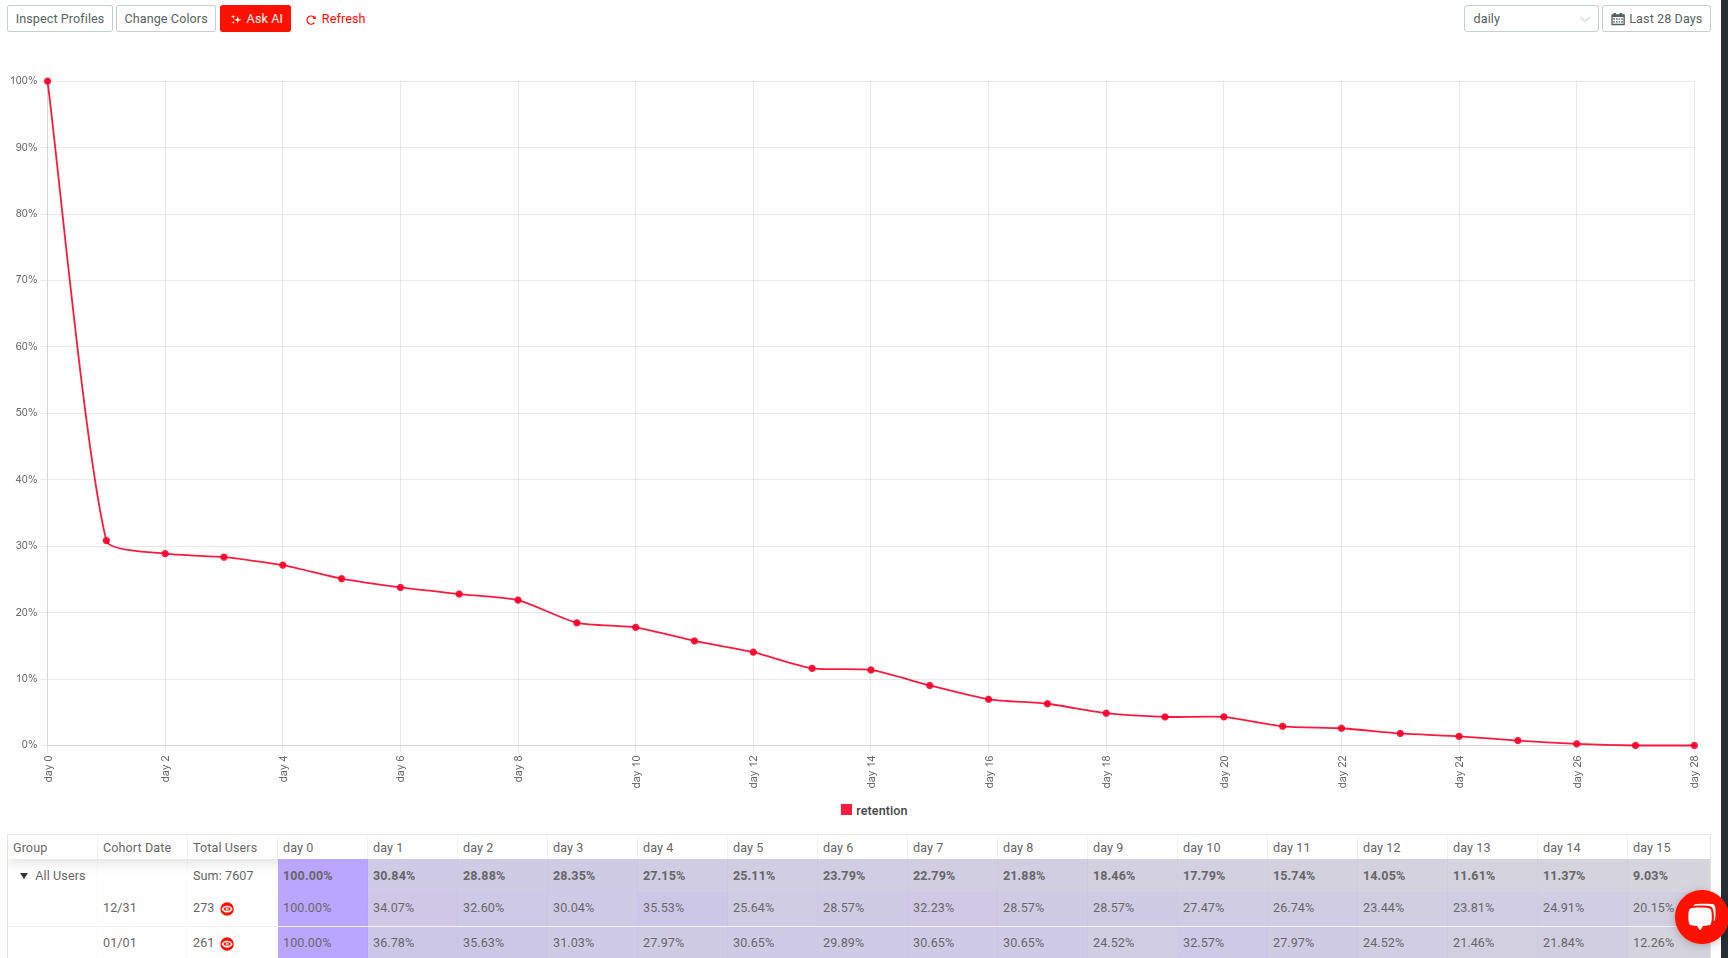
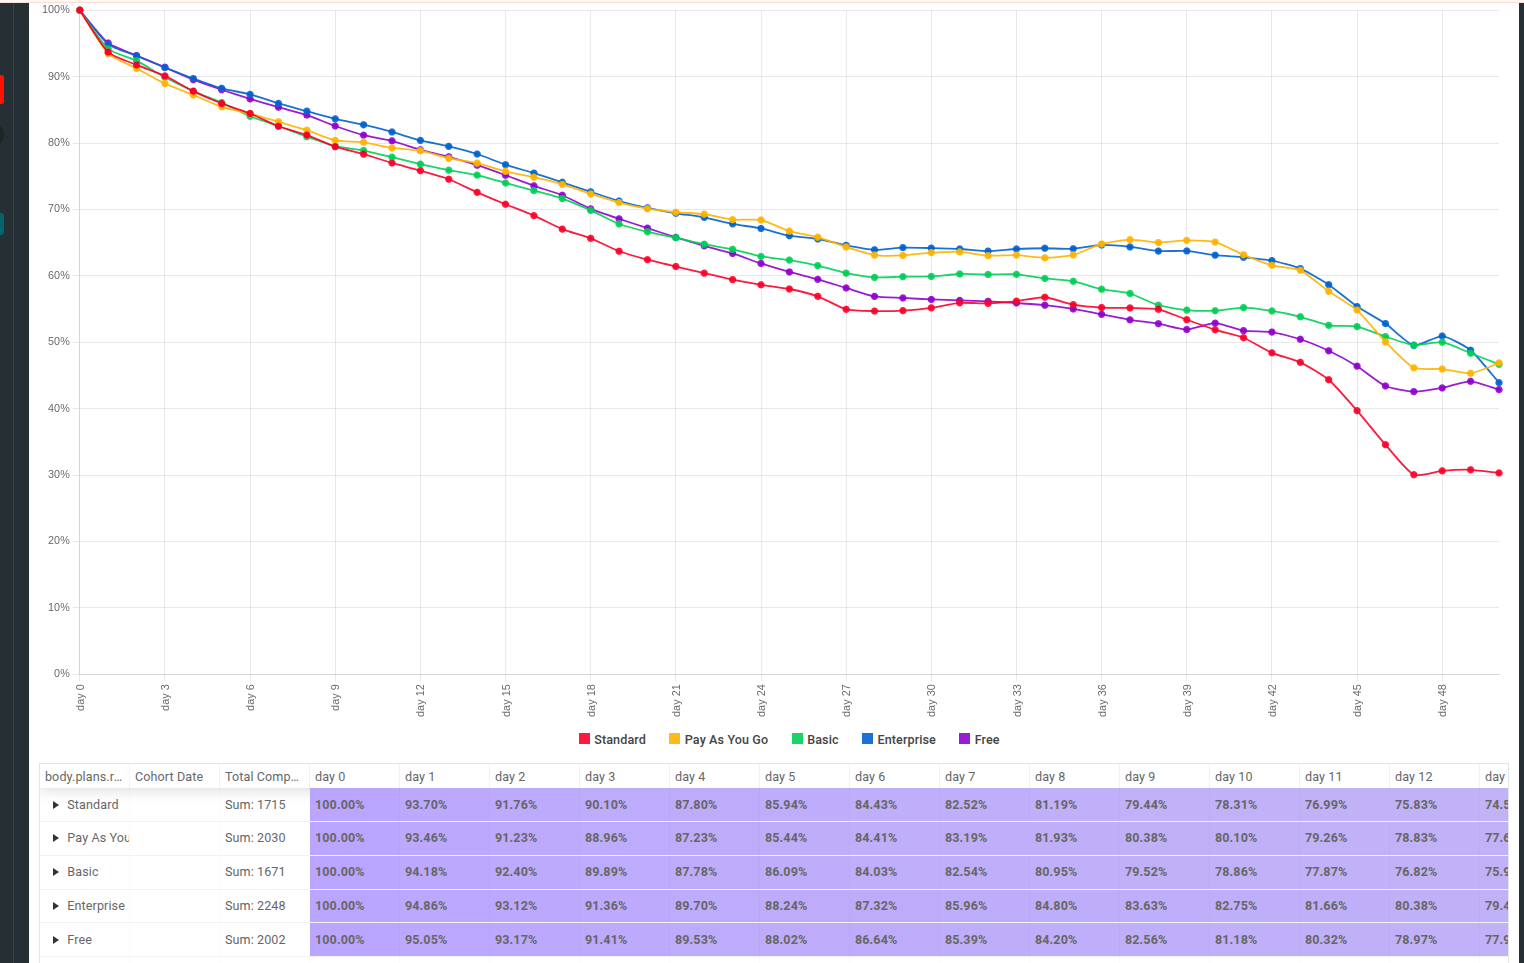
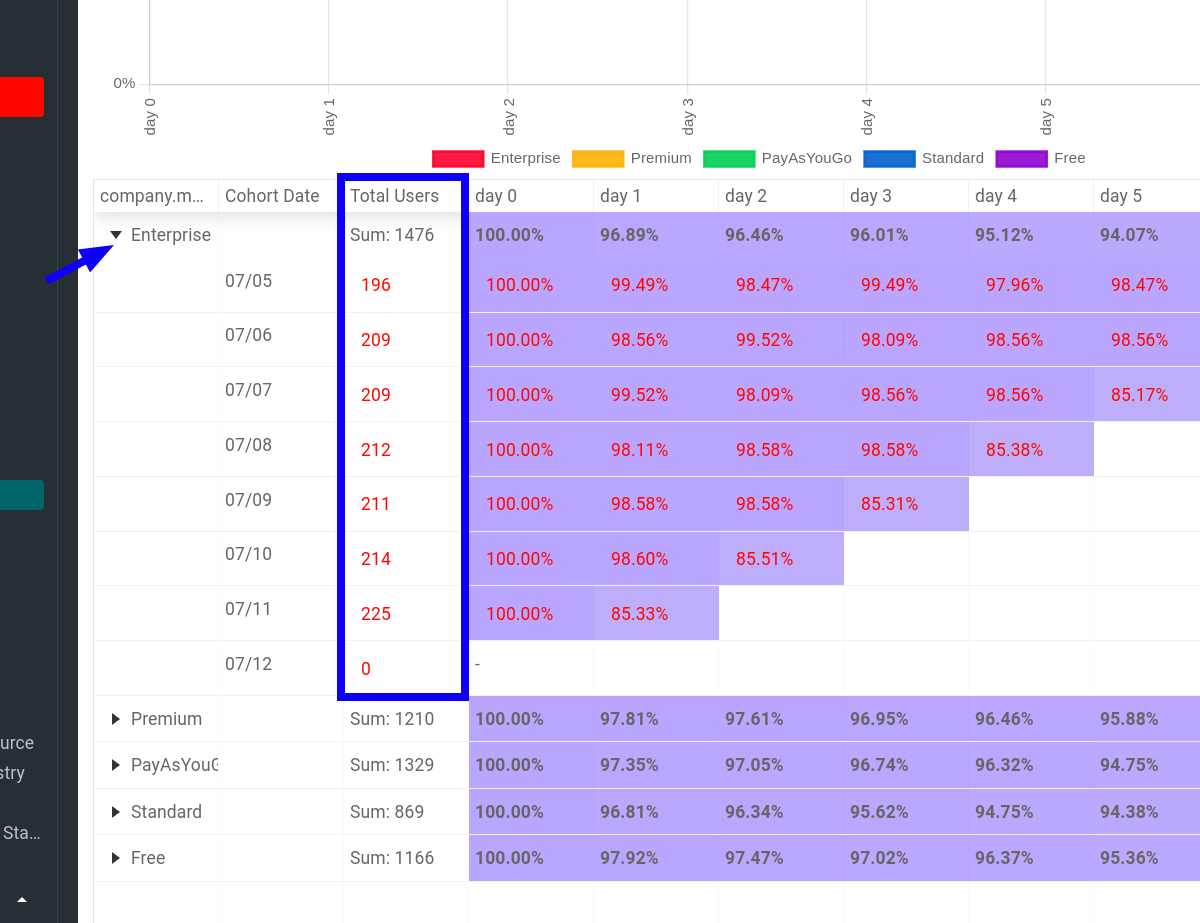
After setting the criteria, you can inspect the resulting chart and table showing user retention data.
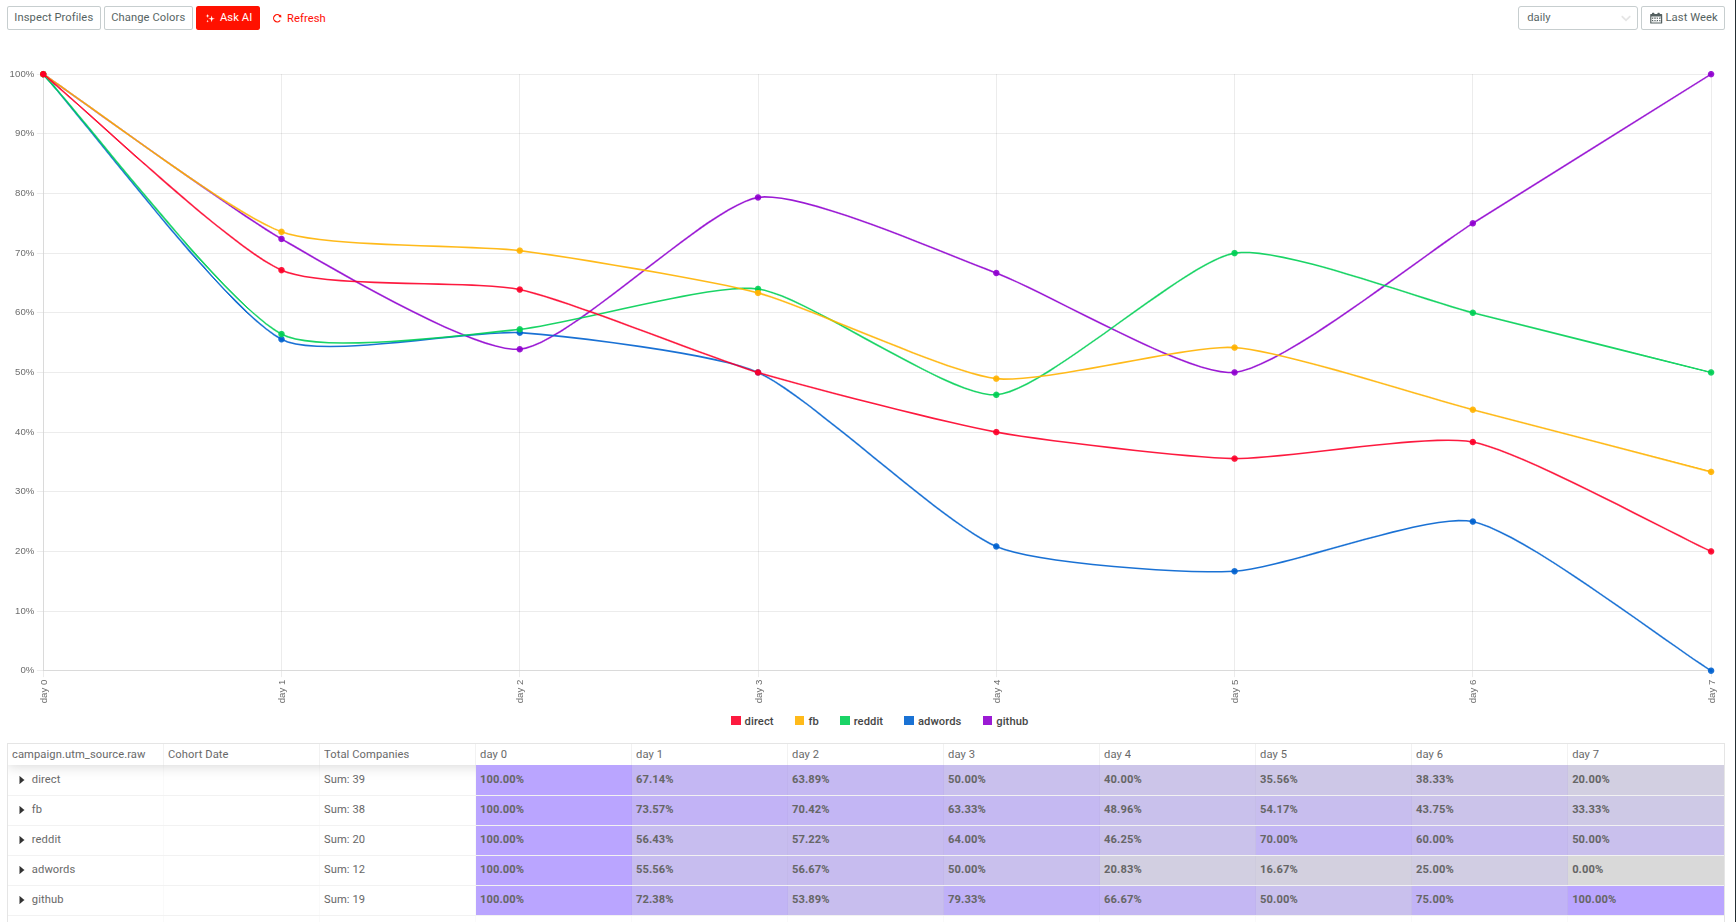
The vertical axis in the chart shows the percentage of users performing the returning event for each interval after the cohort date. The horizontal axis breaks down into cohort date intervals according to the retention interval and the period of time you perform the retention analysis for.
For example, the preceding example illustrates daily retention in the last three days. Therefore, day 1 indicates one day after the cohort date, day 2
two days after the cohort date, and so on.
If instead you select weekly or monthly retention interval, then Moesif counts user for
week 1 if they performed the returning action any day of the following week after the cohort date.
For example, if you show daily retention, then Moesif segments your user base into daily cohorts based on when they performed the first API call.
Configuring Segmentation
By using a segmentation clause in the Segment By pane, you can make the retention analysis only include retention for customers who performed a certain action or belong to a certain segment of the customer base. This can help you see how specific segments perform in terms of retention. Without segmentation, Moesif groups all retention together and creates an average.
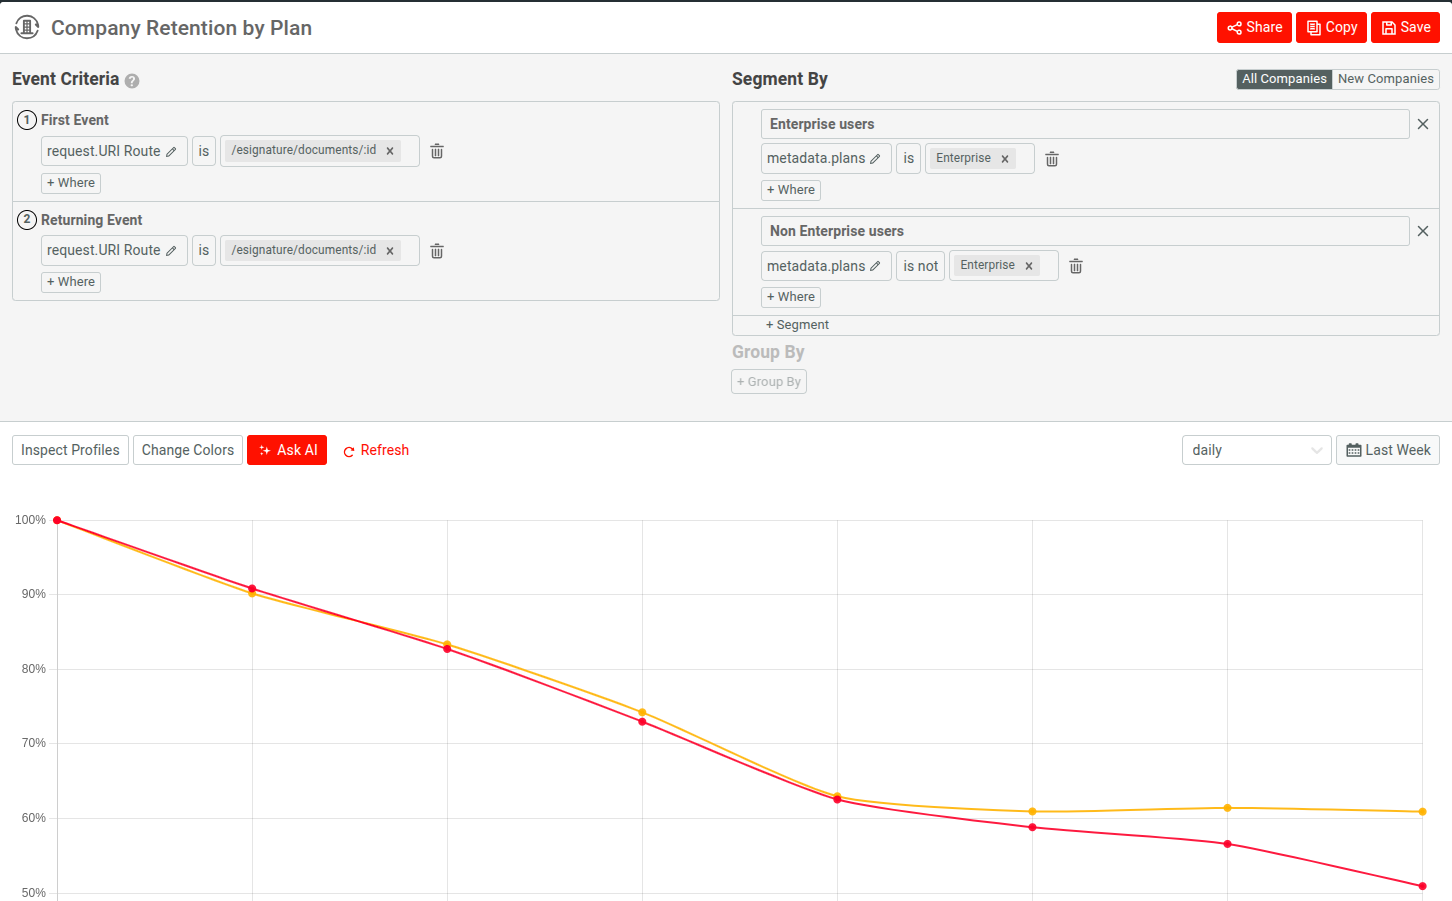
For example, here we add a segmentation clause where we want to look at the differences in retention for customers in both Enterprise and non-Enterprise plans.
Configuring Groups
The grouping feature in the Group By pane allows you to see what the retention looks like across different cohorts of users based on demographic information or acquisition channels. Select + Group By in the Group By pane and then define your criteria by selecting fields to group your customers.
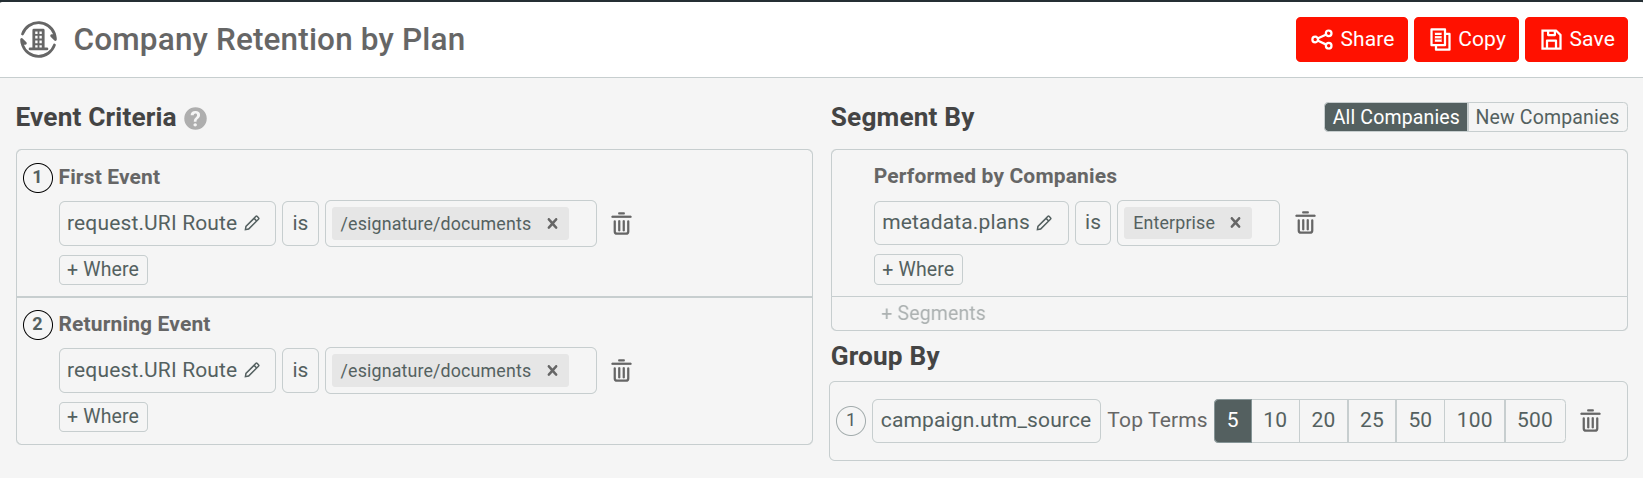
For example, to group users by UTM sources, select the Campaign.utm_source field. This shows what customer retention looks like for users depending on what UTM source they come from.
Setting the Retention Interval
You can set the retention interval in the retention interval dropdown.
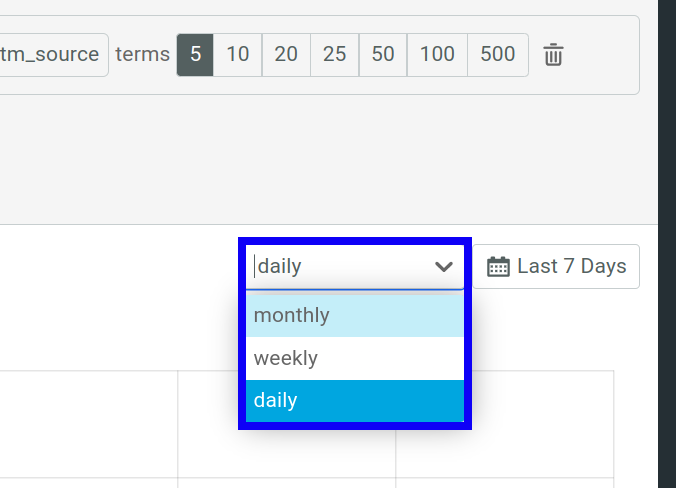
The following intervals are available:
dailymonthlyweekly
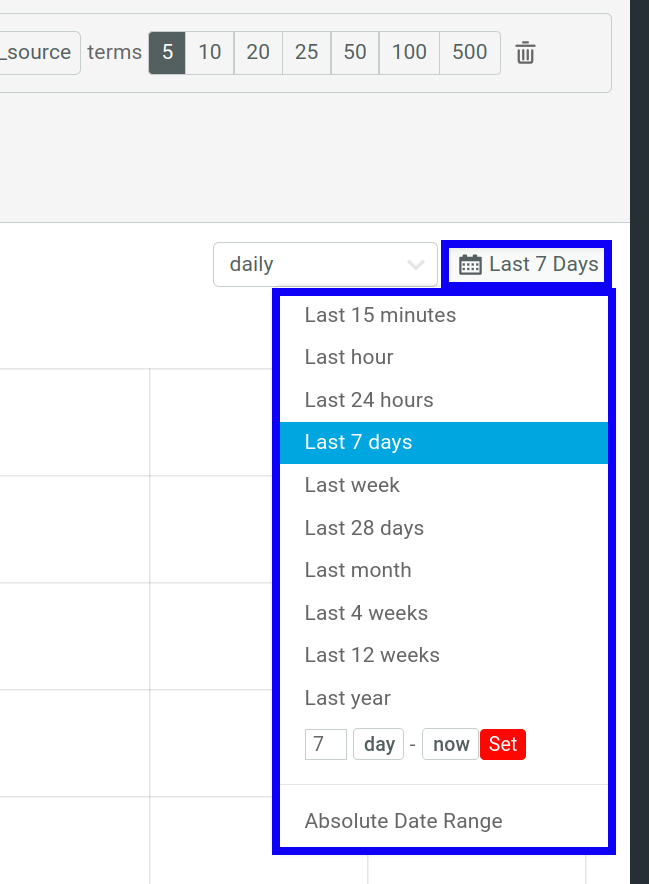
Setting the Retention Analysis Time Span
You can set the retention analysis time span by selecting the interval from the dropdown. You select from one of the builtin time spans, for example, Last 7 days or Last week. If you want more precise control, use the relative date range or absolute date range options.
All Users versus New Users Only
To specify whether you want to include all users or only new users in the retention analysis, select All Users or New Users. By default, Moesif uses All Users.
New Users filters each cohort by only new users. New Users can help you to measure how sticky your adoption funnel is while excluding users who you already consider long-term customers. These users therefore may already have high retention rates.
Alternatively, you can also select All Users to include all users in the analysis.
Profile Inspection
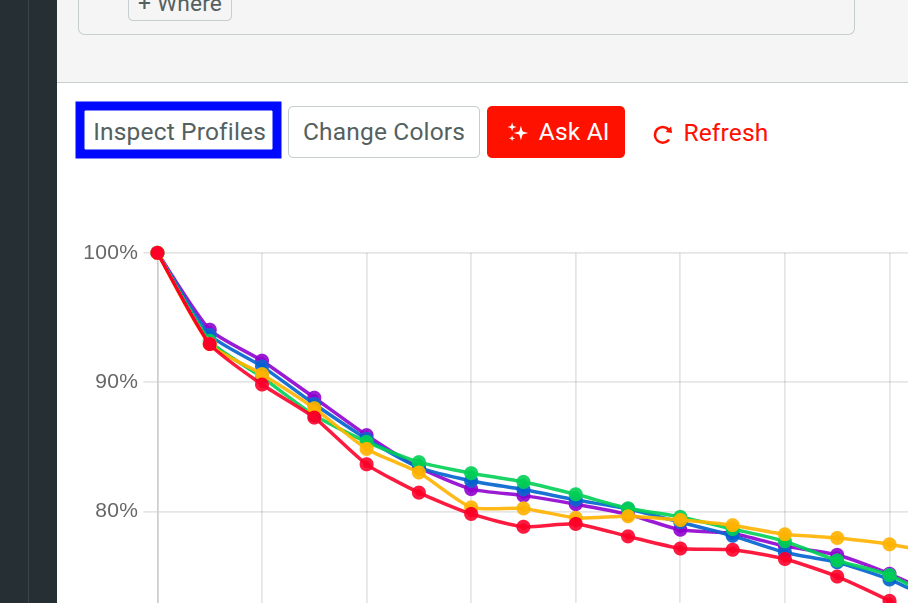
Select Inspect Profiles to include user or company IDs that have recently entered into the retention analysis in the retention data table. To see the IDs, select a group in the retention table and and then select a number in the Total Users column.
A dialog appears with the following information:
- User IDs and corresponding profile pages of users who completed the First Event on that day.
- Link to a Live Event Log metrics report for each user ID.
Interpreting the Results
When understanding a retention report, it might help to keep a few scenarios in mind. Some of these scenarios show healthy retention and others show unhealthy retention or retention that can use improvement.
High or Optimal Retention
The optimal retention rate varies by industry, making it difficult to pinpoint the exact place you want your retention rate to land. Depending on your industry, you obviously want to make sure that your retention curve begins to flatten quickly and stays roughly around the target for your business or industry. You must also consider what efforts go in to have high retention. You need to continue those efforts to keep customers loyal. If retention starts to drop as you make changes to onboarding, business processes, marketing, and other factors, you may want to look at reverting back to tactics that made retention higher. In case retention drops, likely the experience of your service or app have failed to meet the customer expectations. Your customer retention strategy must always aim to keep retention as high as possible.
Retention Drops off Quickly
If retention drops quickly to low levels, this usually means one of these possibilities:
- The product has failed to satisfy the customers
- The customers have not been getting the value out of the product to justify returning.
If you look at retention on a monthly level and by the second month retention drops significantly, you may want to look at retention in a smaller time segment, such as weekly or even daily. With poor retention, small changes may lead to massive differences.
The Retention Report Contains Less History
Consider a business that has only been around for four weeks or you’ve only been tracking retention for four weeks. Then it proves difficult to look at retention on a 12-month basis since the data doesn’t exist. If you find that your retention report stops sooner than you expect, you need to make sure that you have enough data to support the time span that you want to look at. If you have limited data, consider using a smaller unit of time. For example, consider looking at retention on a daily or weekly basis until your data grows big enough to assess at a monthly or yearly level.
AI Explain : Use AI to Get Insights About Retention Analysis
AI Explain gives you an AI-powered conversational interface where you can ask questions and gain insights about retention analytics data.
In a Funnel workspace, select Ask AI to open up the interface. To get started, you can choose from the sample prompts. Otherwise, type in your query and press Enter.
Save and Share
Moesif gives you several options to share a Retention analysis workspace. Before you can share, you must first save the workspace to a dashboard.
After saving, follow the instructions in Sharing Workspaces to share your workspace.