Trace Explorer
This document explains how to use Trace Explorer in the Moesif’s API Analytics suite.
Trace Explorer is superceding the Traces view in Live Event Log. Therefore, to access trace data, you will need to open a new Trace Explorer workspace.
Overview
Trace Explorer allows you to observe OpenTelemetry traces, their constituent spans, and logs in real time across your applications and services. You can filter by various attributes, like trace ID, request and response data, and user and company data like user and company ID. Trace Explorer provides an easy-to-navigate means for real-time, continuous observability into your platform.
For a step-by-step guide on how to integrate OpenTelemetry and Moesif with your application, see Integrating with OpenTelemetry.
Use Cases and Benefits
Trace Explorer provides a dedicated workspace to visualize the end-to-end journey of requests across your distributed systems. It unifies OpenTelemetry traces with correlated logs and helps construct and observe a cohesive story of system behavior, without having to integrate another observability tool separately.
Here are some example use cases and benefits:
- If you observe failed API requests in a complex network of services, use Trace Explorer to follow the trace ID across every service boundary. You can exactly identify the microservice or specific database query that triggered the error.
- If a process takes more time than usual, Trace Explorer can help confirm where the delay originates from.
- Observe spans and logs for non-deterministic issues, like intermittent race conditions, that affect user experiences despite not triggering standard alerts.
- Analyze the impact of new code deployments by evaluating traces before and after a release to see if internal dependency calls have increased.
- Observe logs emitted during a specific operation directly alongside its trace span, easing investigation during a high-traffic incident.
- Having traces and logs in a single configurable workspace means you don’t need to manually correlate timestamps.
- A single workspace makes sure that every team observes the same correlated data.
- Traces’ visual nature helps new team members understand how services interact in production, illustrating a “living map” of the architecture.
Create Trace Explorer Workspace
To access Trace Explorer and create a new Trace Explorer workspace, select + Create New in the navigation menu and then select Trace Explorer from the API Observability section.
Filters
You can refine the the trace and span data Moesif displays using filters. To access the filters, select the span filters list in the Filters pane.
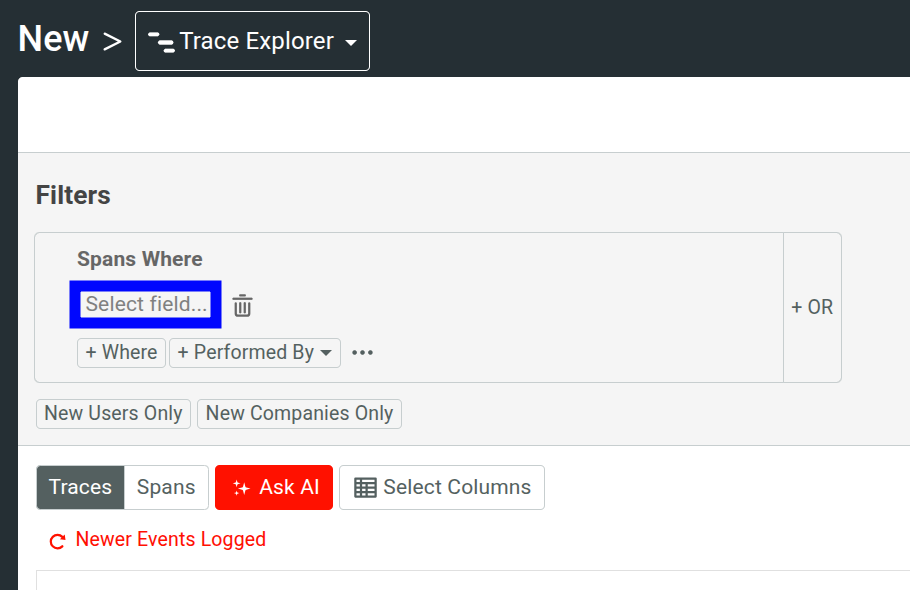
For more information about the available filters, see Reference: Analytics Filters.
You can chain multiple filters together by selecting Where and OR.
Filter By Cohorts
You can further refine the viewed trace data by selecting a user or company cohort from the Performed By list:
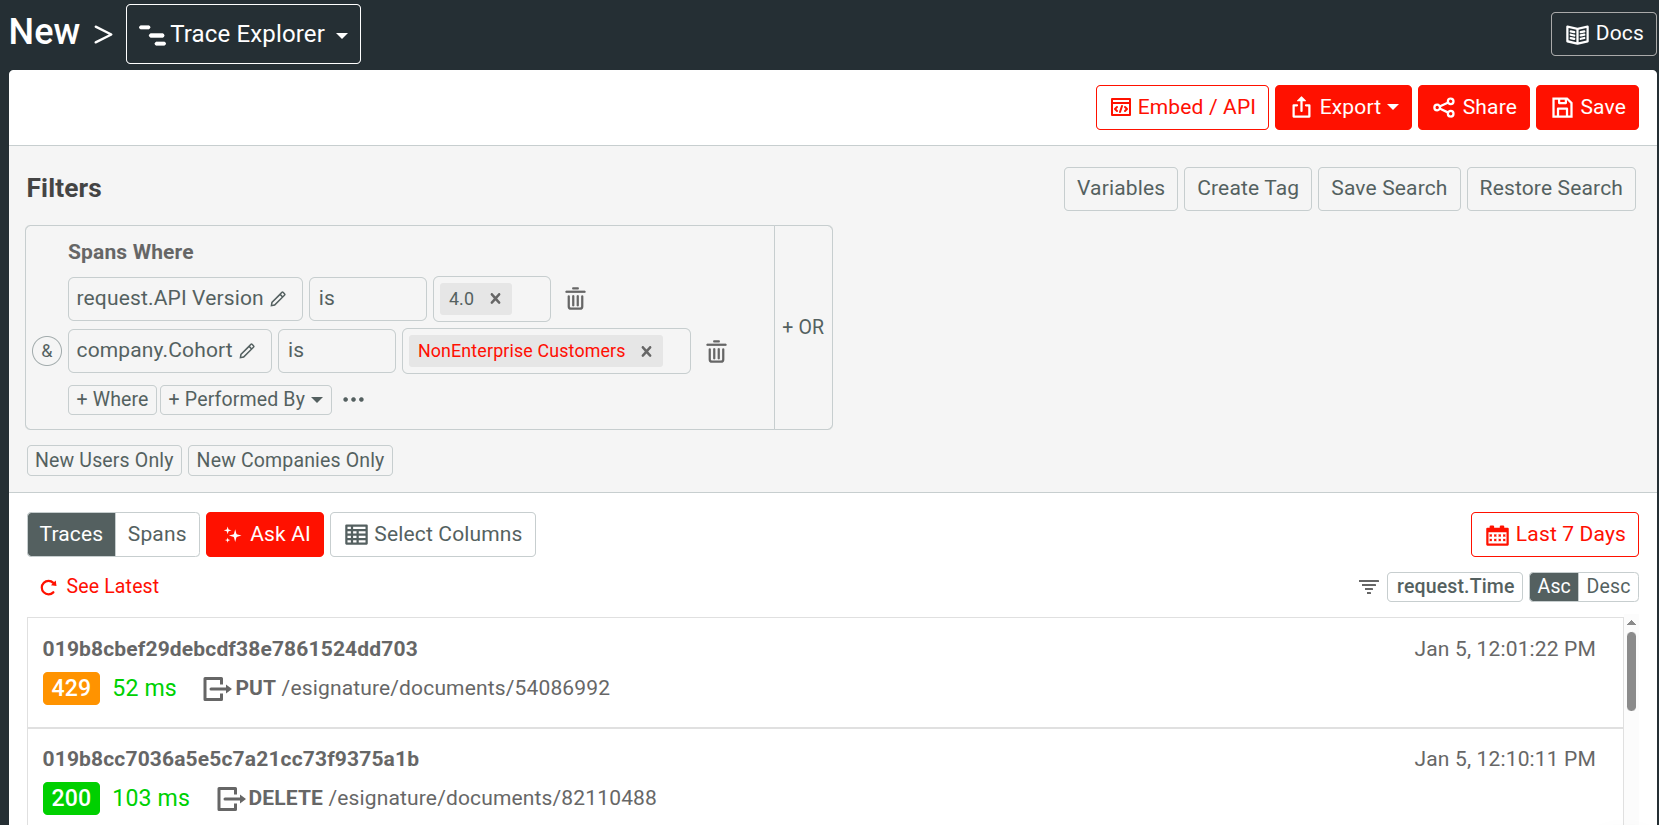
This allows you to observe traces pertaining to specific customer cohorts—for example, new users that have been encountering errors or events for enterprise customers. For example, the following filters out enterprise customers and displays traces for non-enterprise customers only for a specific API version:
Inline Cohorts
Use inline cohorts to define a cohort criteria directly in your Trace Explorer workspace. This allows you to instantly refine your analysis when you don’t already have an existing cohort to filter by.
To define an inline cohort, select Performed By and then select + Inline User Cohort or + Inline Company Cohort. It opens up a new dialog where you can define a cohort criteria using customer and event filters.
Analytics and Filtering on HTTP Payload
Moesif allows you to define filters on and analyze HTTP bodies, even for deeply nested structures. To access HTTP event data like request and response payload, select a trace and then select one of the spans to access the span details.
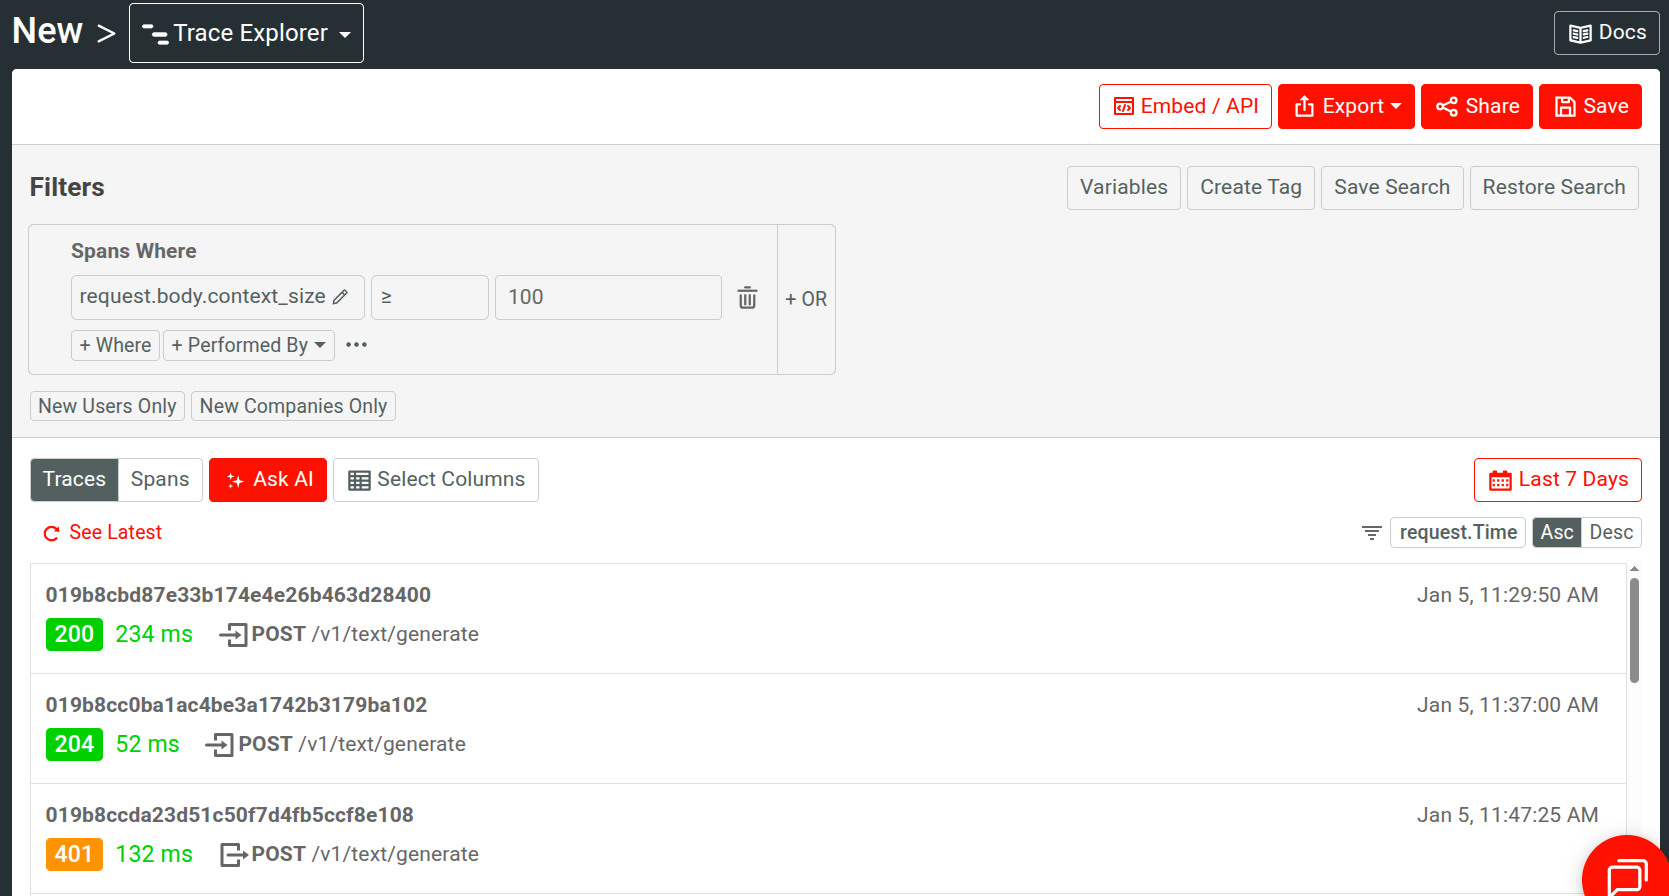
For example, here we observe traces for events that have large context size in an AI API product:
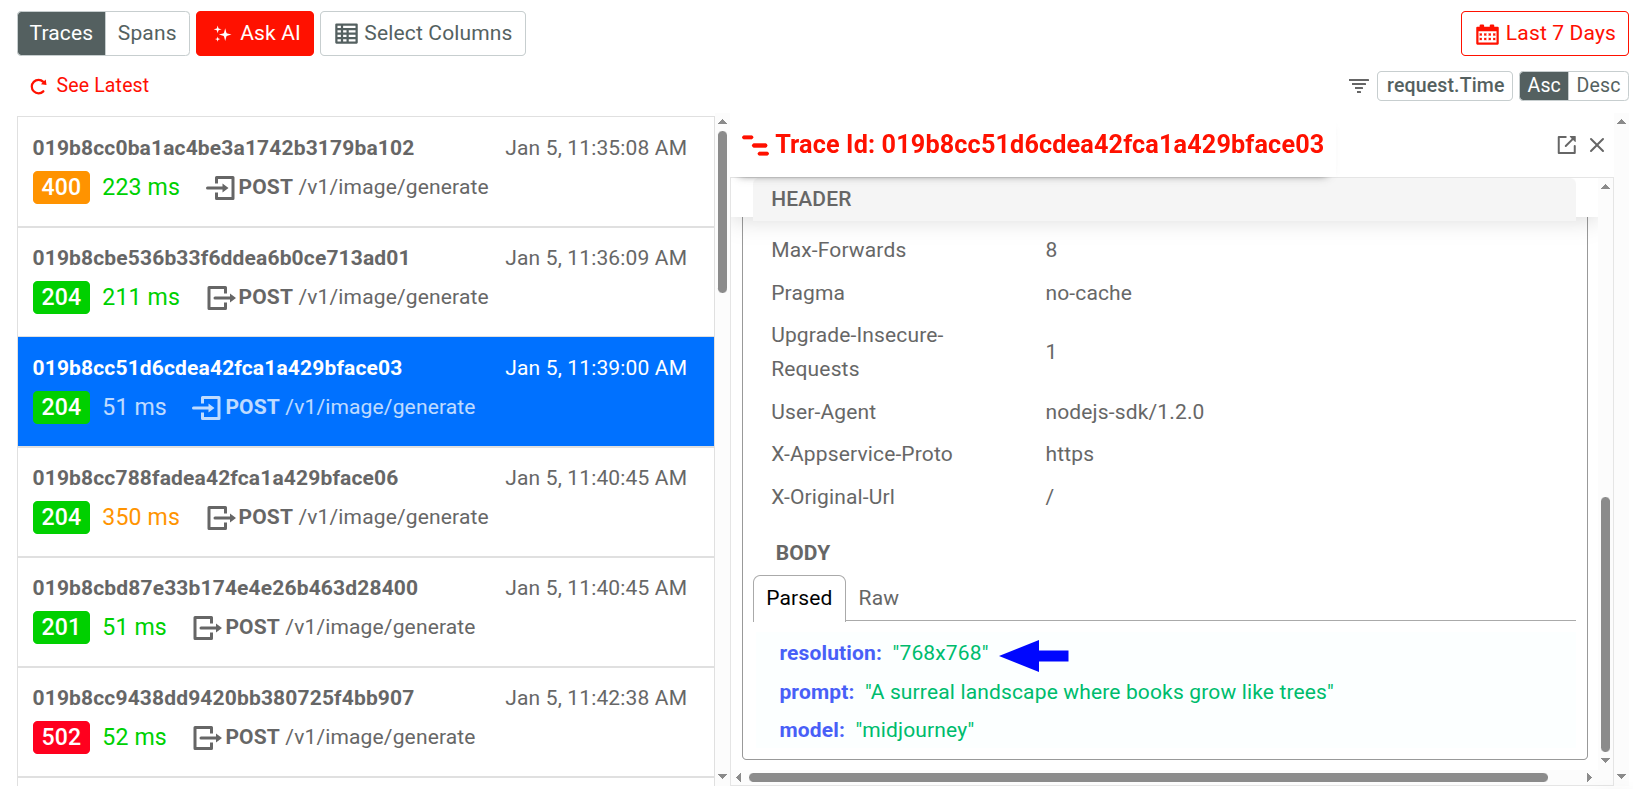
You can also select a specific body field key or value and choose to define filters directly
from there. For example, here we’re interested in the image resolution data in the
request body for an API call in an image generation API. If we select one of the
filtering options, Moesif includes or excludes API calls that have requested to generate
768x768 resolution images.
For more information about interacting with event data fields this way, see Event Data Field Options.
Named Variables for Filters
You can define named variables that hold filter values and then use it across filters.
To add filter variables, select Variables. Then select Add Variables to define a variable. After defining your variables, select Save.
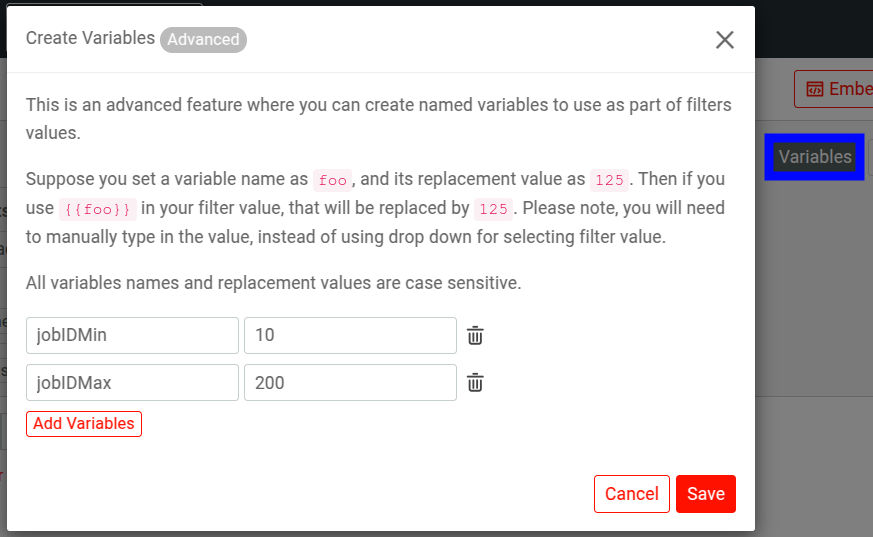
To use a variable, enter the variable name enclosed in double curly braces in a filter value. For example:
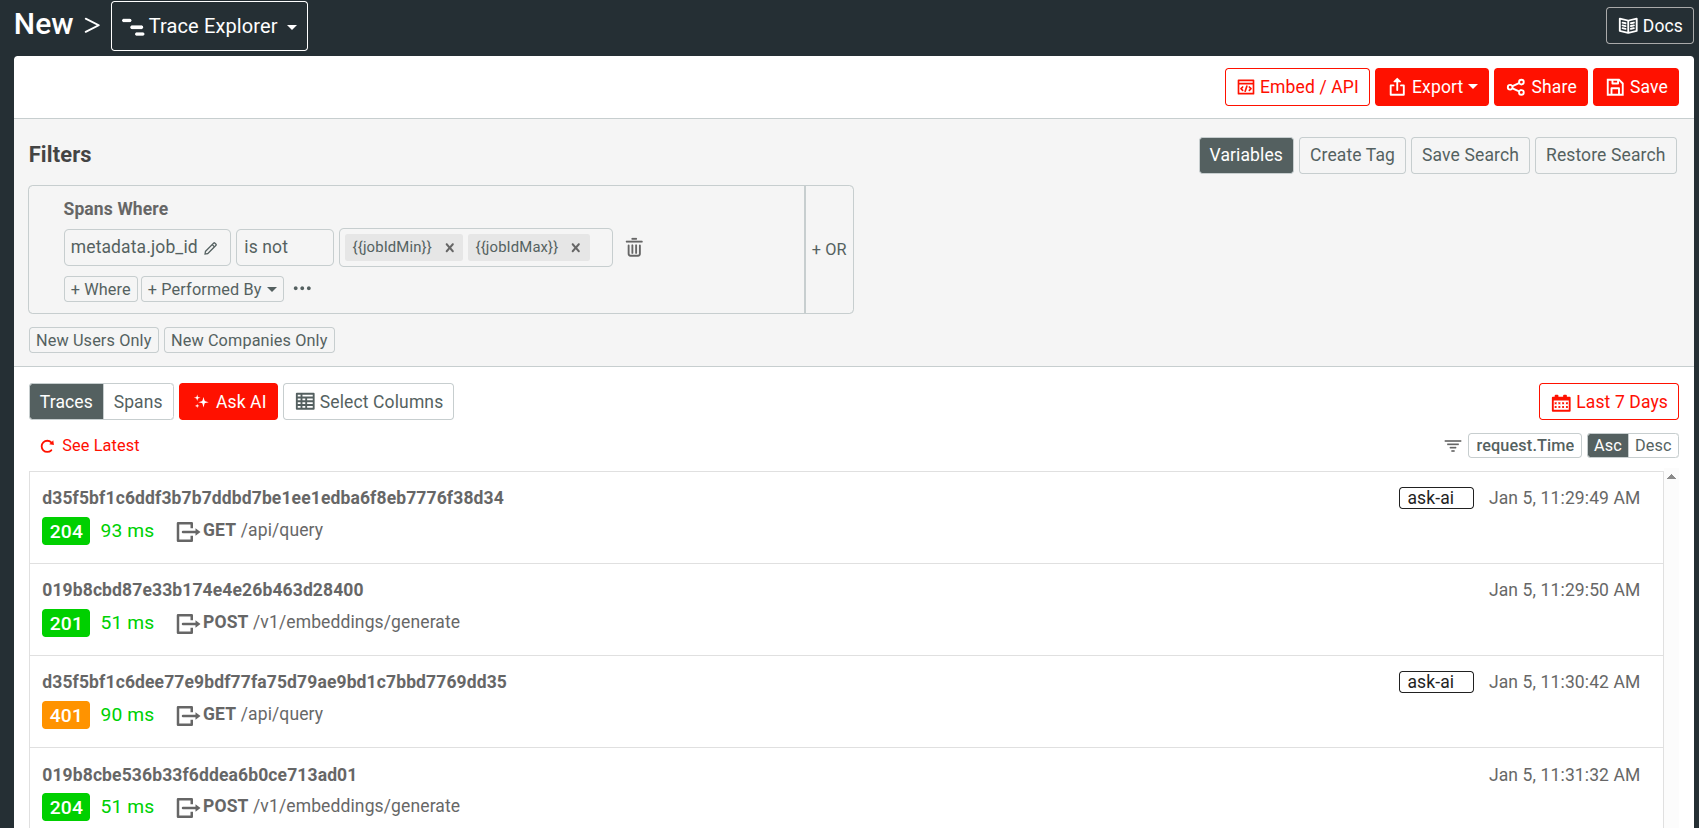
You must manually enter the variable name this way to use it. You can quickly check defined variables by hovering over Variables—the tooltip shows the defined variables and their values.
This feature allows you to avoid manually updating filter values in complex and dynamic filtering scenarios.
View Events for New Users and Companies Only
To see traces pertaining to only new users and companies, enable the New Users Only and New Companies Only filters respectively. These two filters allow you to see events for users or companies who’ve made their first API call within the time period you specify.
Trace Data Views
You can switch between two views in Trace Explorer:
- Trace View
- Span View
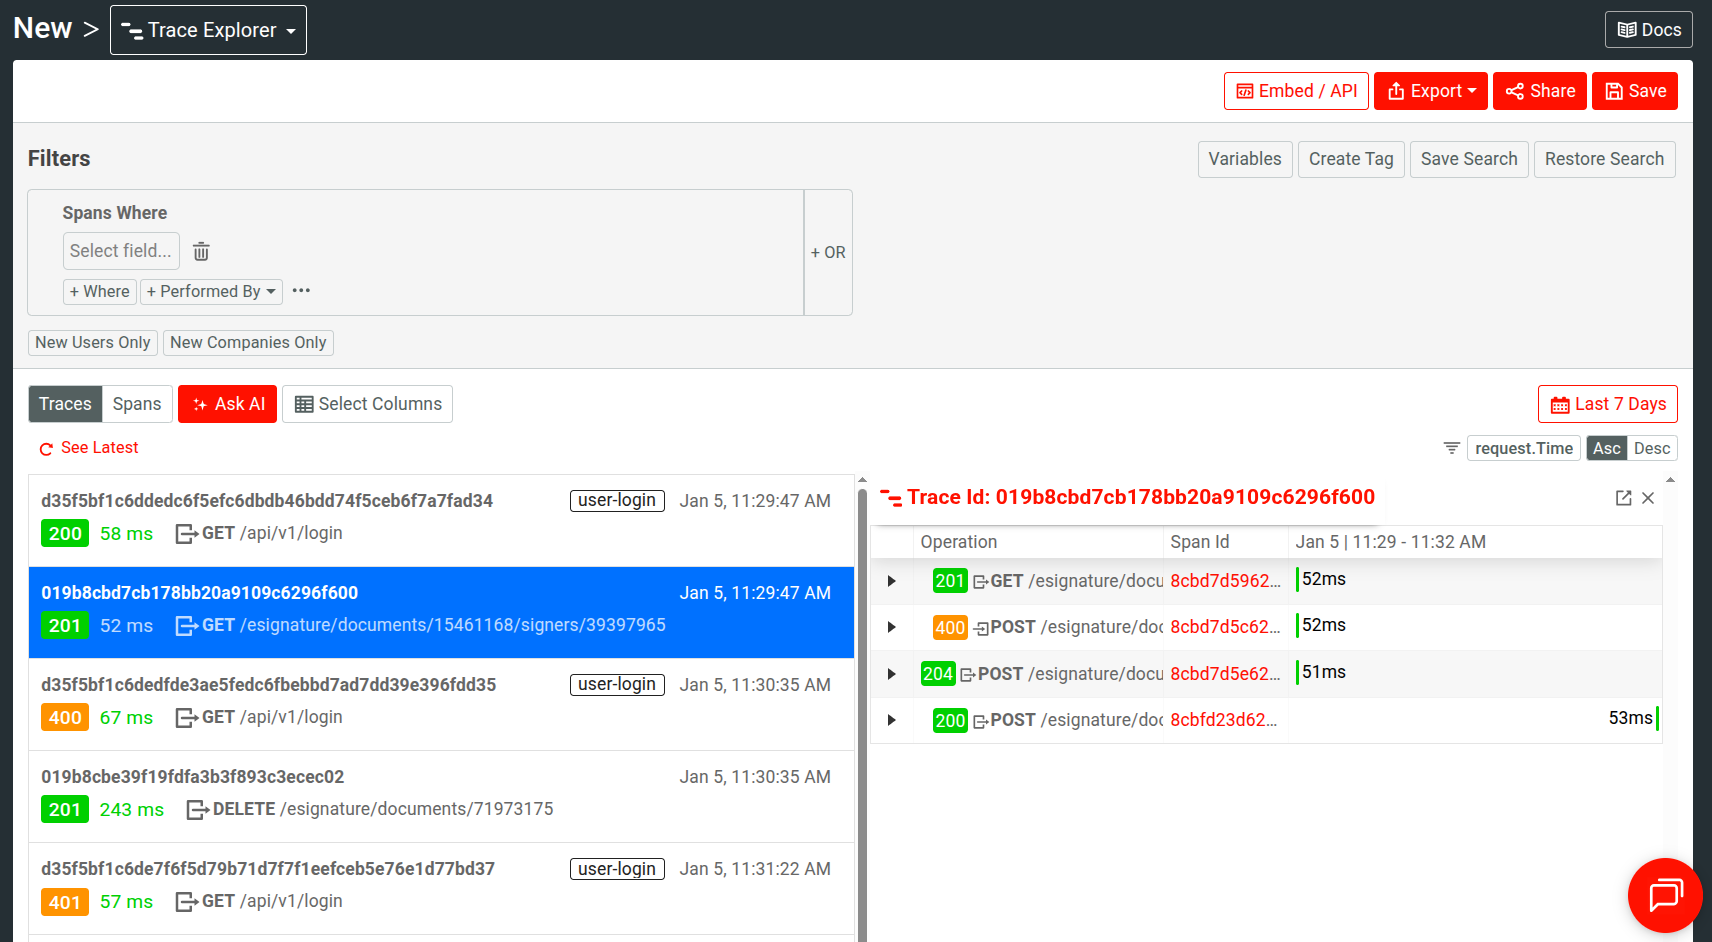
Trace View
Displays traces and logs data. Selecting a trace opens more details about its constituent spans and the correlated logs.
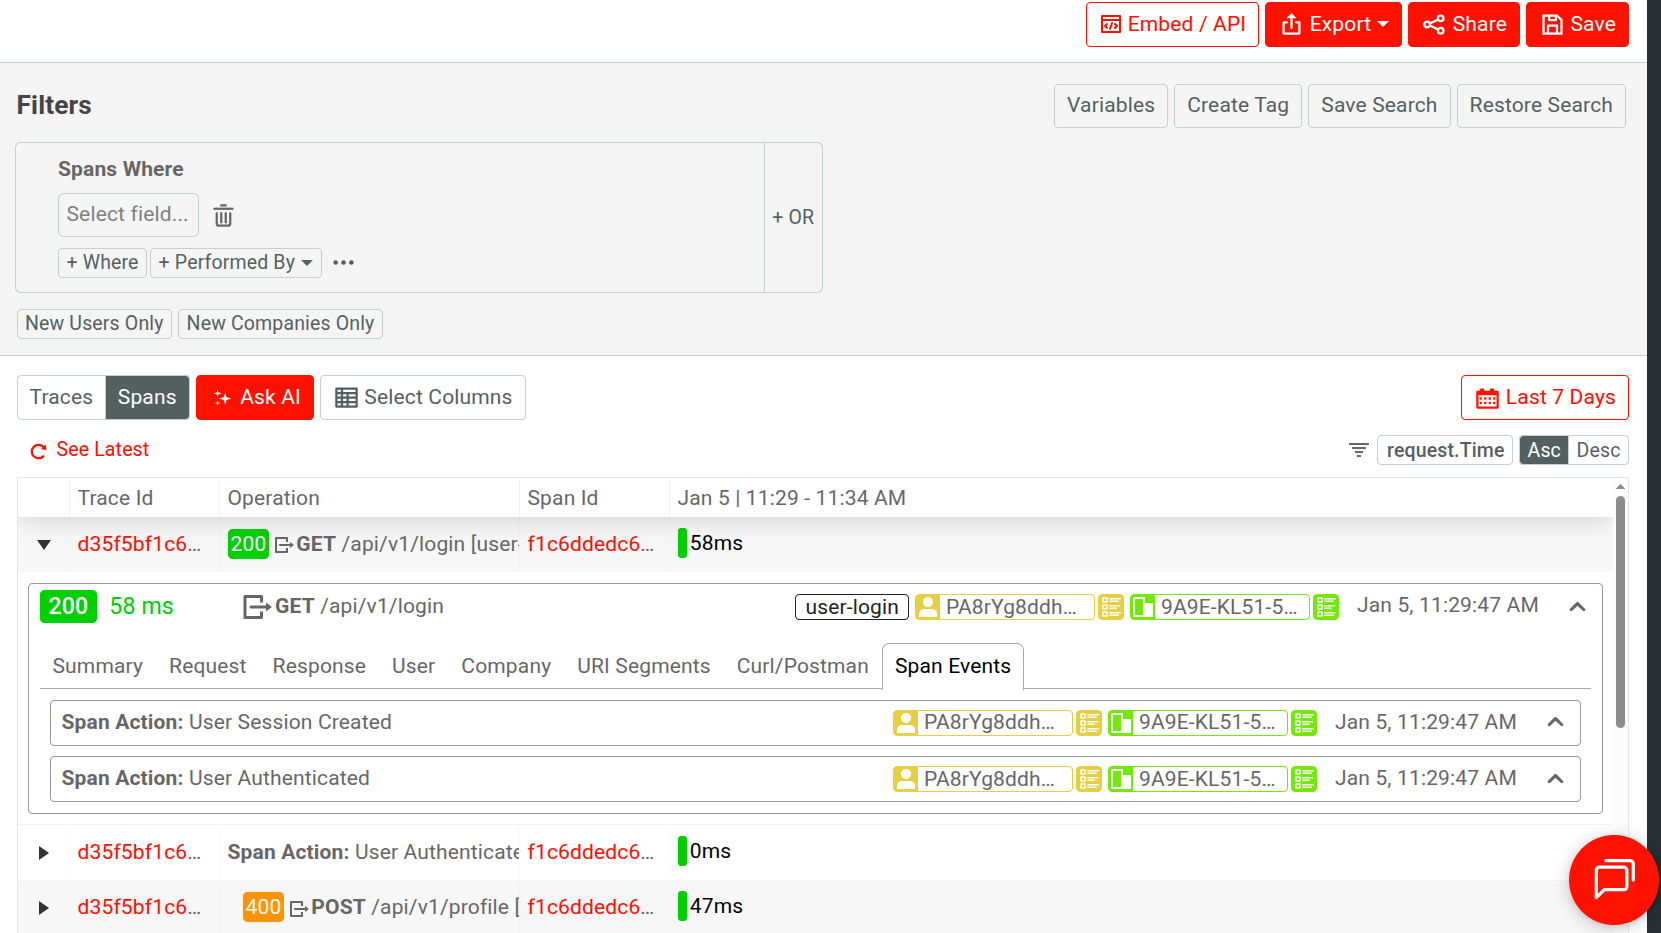
Span View
Displays spans and logs data including their time axis visualization and corresponding operations. Selecting a span opens more details about the event, like event type and trace ID.
In the expanded menu for a span, you can go to Span Events to view Span Event data for the span. Span Events is also available in the Stream view of Live Event Log workspaces.
Event Data Field Options
You can interact with individual event data fields and field values in Trace Explorer:

In the dropdown, you can view more detailed information about the data element and perform further actions on that specific data. For example, you can filter and sort, plot the data as a metric in a different chart, and so on.
Save and Share
Moesif gives you several options to share a Trace Explorer workspace. Before you can share, you must first save the workspace to a dashboard.
After saving, follow the instructions in Sharing Workspaces to share your workspace.
AI Explain : Use AI to Get Insights About OpenTelemetry Data
AI Explain gives you an AI-powered conversational interface where you can ask questions and gain insights about OpenTelemetry traces and logs.
In Trace Explorer, select Ask AI to open up the interface. Moesif selects the first 30 events as target events for the AI to analyze and answer your questions about. A maximum of 30 events at a time can be analyzed.
To get started, you can choose from three sample prompts. Otherwise, type in your query and press Enter.