Using Moesif for API Observability and Analytics in NGINX One

NGINX One provides a modern solution for enterprises to manage infrastructure at scale across globally distributed systems. The platform has built-in tools for essential performance and uptime metrics, giving DevOps teams visibility into the health of their NGINX instances.
But for effective API observability and analytics, you have to go beyond infrastructure metrics. You can’t improve customer experience or troubleshoot failing endpoints without understanding what users are doing, where they’re encountering errors, and why performance varies across API consumers.
By layering Moesif’s deep API traffic inspection and user-centric API analytics on top of NGINX One, you can gain end-to-end visibility into every API call. This visibility covers not just the perspective of systems, but the behavior of customers themselves.
In this article, we’ll discuss how Moesif can help you establish deep API observability and analytics in NGINX One.

Table of Contents
- What is NGINX One?
- What is Moesif?
- Why Use Moesif with NGINX One?
- Integrating Moesif with NGINX One
- Key Metrics to Track for API Analytics and Observability
- Conclusion
What is NGINX One?
F5 NGINX One, building on the core NGINX tech, is a fully managed application delivery solution for modern applications. It provides a centralized interface to observe, manage, secure, and scale both NGINX Open Source and NGINX Plus instances across diverse environments like Kubernetes, cloud, and on-premises setups.
NGINX One enables fine-grained operational visibility using NGINX Agent that runs alongside your NGINX instances. The Agent collects system metrics about your data plane systems as well as traffic metrics like basic HTTP status code distributions. NGINX One also allows you to pre-configure and stage NGINX configurations, allowing DevOps teams to standardize deployments across environments while minimizing drift. The platform also supports secure integration of your NGINX instances with NGINX One Console through data plane keys, in addition to role-based access control features to govern permissions and access.
If your organization is already invested in NGINX, NGINX One offers operational consistency and governance at scale. However, if you want to understand the behavior of API products or the users who consume them, you need a bespoke solution.
What is Moesif?
Moesif is a powerful API observability platform that captures, enriches, and analyzes API traffic to give engineering and product teams actionable insights into usage patterns, customer behavior, and performance. Unlike traditional logging or APM tools, Moesif operates at the API layer—extracting context-rich telemetry from every API call, including headers, payloads, query parameters, latency, authentication tokens, user IDs, and more.
Moesif uses lightweight SDKs and plugins (like its Lua-based plugin for NGINX) to instrument API traffic directly at the edge, without impacting API performance. Moesif can enrich each event with metadata like geo-location, cloud provider, and API version before asynchronously streaming to its cloud backend for real-time analysis. This means you can slice and filter traffic by virtually any dimension—endpoint, HTTP method, customer ID, error type, API version, deployment region, or SDK used—and correlate issues directly to impacted users.
A core tenet that distinguishes Moesif is its commitment to making observability customer-centric. Some of the features that make it happen are profile dashboards for individualized account metrics, cohort analytics, funnel tracking, and customizable API monitoring and alerts. These features empower teams to not only detect problems but understand who they affect, how often, and why. You may have use cases ranging from performance monitoring to debugging, user onboarding analysis, and security anomaly detection—Moesif grounds all of them in a single API event stream.
Why Use Moesif with NGINX One?
While NGINX One gives you operational control over your NGINX infrastructure, it doesn’t tell how your services are being used or by whom. Moesif’s specialized observability layer, designed for API-first products, brings real-time access to the kinds of data engineers, DevOps, and product teams need to make informed decisions.
Infra Metrics vs. API Observability
NGINX One collects infrastructure-level metrics like the following:
- Active and idle connections
- Requests per second
- Upstream health and load distribution
- HTTP status code aggregates
- SSL certificate status and expiration
- Cache hit-and-miss ratios
Infrastructure teams use these data to monitor routing health, optimize load balancing, and track web server throughput. However, they don’t capture application-level behavior: you can’t see the payload of a failing API call, segment traffic by authenticated users, or analyze endpoint-specific latency distributions.
Moesif, operating at the API layer, allows you to understand how clients use your APIs. If you can analyze each API request and response in full context, your teams can dig out answers to questions like these:
- Which customers are seeing the most errors?
- What’s the average latency for this specific endpoint?
- Has onboarding conversion dropped this week?
How the Moesif Plugin Works
The Moesif Lua plugin runs in NGINX through the NGINX Plus Lua Module that integrates Lua coroutines into the NGINX event processing model. This gives Moesif access to NGINX’s HTTP request processing phases and therefore the ability to capture data like the following:
- HTTP request and response headers
- Full request and response bodies (configurable)
- Route, method, and HTTP status code
- Latency, user agent, geolocation, and IP address
- Customer identification and attribution through request header and NGINX variables
Moesif asynchronously captures these events and batches them before dispatching to its analytics engine. As a result, you get non-blocking operations, preserving NGINX’s high-throughput model. The plugin works on both NGINX Open Source and NGINX Plus. For performance-sensitive environments, an optional C module is available for NGINX Plus for more advanced use cases.
You can configure the plugin to mask sensitive fields, or enrich events with custom context—making it flexible for observability needs without barring compliance requirements.
Real-Time API Monitoring and Filtering
Moesif’s Live Event Log gives real-time view into API events:
- Watch API requests as they happen across all NGINX instances.
- Filter by criteria such as response code—for example
500 Internal Server Errors, user ID, route, or specific headers. - Drill into request-response bodies to troubleshoot errors or understand edge cases.
This fundamentally differs from looking at logs through access_log and error_log directives, or waiting on delayed metric exports. With Moesif, you can build an observability discipline that ensures interactivity with your observability data in real time, to debug, validate deployments, or support customers.
Traffic Segmentation
Moesif’s API and customer analytics lets you group, filter, and chart API traffic across any dimension:
- By customer: authenticated user or company ID
- By endpoint: URI patterns, methods, query parameters
- By client type: SDKs (Node.js, Python, Go), CLI tools, or custom agents
- By geography: country, region, city
- By time: minute, hour, day, or custom time buckets
This enables API teams to compare performance across different segments. For example, you can see whether a specific enterprise customer is experiencing slower P99 latency or whether a new SDK release has led to a spike in malformed requests. NGINX One does not support this kind of slicing — it sees requests as raw traffic, not structured interactions.
Faster Troubleshooting and Root Cause Analysis
When something breaks in production, speed matters. Moesif empowers teams to resolve incidents faster by:
- Highlighting error rate spikes by route, customer, or API version
- Correlating
4xxclient and5xxserver error responses with specific payloads or query parameters - Tracing a user’s activity across multiple endpoints for post-mortem analysis
- Filtering traffic by API key or IP to isolate suspicious or abusive usage
- Enhancing observability by leveraging your app’s existing distributed tracing with
Especially, if you’re managing dozens of NGINX instances under NGINX One, rather than sifting through raw logs, your teams can narrow down incidents in Moesif within seconds.
Alerting, Anomaly Detection, and Automation
Moesif supports both static and dynamic alerting:
- Static alerts: Set thresholds for latency, error rates, or request volume
- Dynamic alerts: Identify unknown unknowns using Moesif’s anomaly detection engine
- Customer-scoped alerts: Notify teams when a specific user’s error rate increases
- Behavioral triggers: Detect when a new developer makes their first API call or usage drops off
You can specify where to dispatch alert notifications to—Slack, PagerDuty, webhook, or email. This enables automation, support workflows, or incident response processes. Moesif’s real-time API intelligence sharply complements the infrastructure-focused alerts available in NGINX One.
Built for Enterprise Observability
For enterprise engineering teams, Moesif enables:
- Compliance reporting: Track access and API usage across users and regions
- SLA tracking: Monitor latency and error rates for each customer segment
- Cross-functional dashboards: Share API and customer analytics insights with product, ops, or support teams
- OpenTelemetry integration: Correlate API calls with distributed traces and logs across services
Integrating Moesif with NGINX One
Before installing Moesif’s Lua-based NGINX plugin, make sure you install the NGINX Plus Lua Module.
Then follow these steps:
Step 1: Install the Moesif Lua Plugin
Use Luarocks to install the plugin:
luarocks install --server=http://luarocks.org/manifests/moesif lua-resty-moesif
Step 2: Configure NGINX
In your nginx.conf, configure the shared memory dictionary and Lua package installation paths:
lua_shared_dict moesif_conf 5m;
lua_package_path "/usr/local/share/lua/5.1/lua/resty/moesif/?.lua;;";
moesif_conf contains static configuration options like your Moesif Application ID and request and response masks.
Step 3: Initialize Moesif
Using the init_by_lua_block directive, initialize the Moesif client, replacing YOUR_MOESIF_APPLICATION_ID with your Moesif Application ID.:
init_by_lua_block {

    local config = ngx.shared.moesif_conf;
    config:set("application_id", "YOUR_MOESIF_APPLICATION_ID")

    local mo_client = require "moesifapi.lua.moesif_client"
    mo_client.get_moesif_client(ngx)
}
This step loads the Moesif library and prepares it to process API events.
After logging into Moesif Portal, you’ll find your Moesif Application ID during the onboarding steps. However, you can obtain it anytime by following these steps from the Moesif Portal:
- Select the account icon to bring up the settings menu.
- Select Installation or API Keys.
- Copy your Moesif Application ID from the Collector Application ID field
Step 4: Capture Requests and Responses
Use the access_by_lua_file and log_by_lua_file directives to capture request and response data:
server {

  listen 8080;

  # Customer identity variables that Moesif will read downstream

  set $moesif_user_id nil;
  set $moesif_company_id nil;


  # Request/Response body variable that Moesif will use downstream

  set $moesif_res_body nil;
  set $moesif_req_body nil;

  access_by_lua_file /usr/local/share/lua/5.1/lua/resty/moesif/read_req_body.lua;
  body_filter_by_lua_file /usr/local/share/lua/5.1/lua/resty/moesif/read_res_body.lua;
  log_by_lua_file /usr/local/share/lua/5.1/lua/resty/moesif/send_event.lua;

  # Sample Hello World API
  location /api {
     add_header Content-Type "application/json";
     return 200 '{\r\n  \"message\": \"Hello World\",\r\n  \"completed\": true\r\n}';
  }

  location / {
    proxy_pass http://ai_api.com/internal;
  }
}
In the preceding example configuration:
access_by_lua_fileallows Moesif to capture request data.body_filter_by_lua_fileallows Moesif to read the response data.log_by_lua_filesends the complete event data to Moesif asynchronously after the response finishes.
Notice the variables $moesif_user_id and $moesif_company_id. These allow you to tag traffic with customer-specific identifiers so you can perform analysis like Segmentation in Moesif.
Step 5: Verify Your Setup
Once the integration completes, send a few API requests to your NGINX instance. Then, after logging in to your Moesif account and opening a Live Event Stream workspace, you should see new events appear in real time.
If you face any issues, see the Server Troubleshooting Guide or contact our support team.
See the Moesif Lua plugin documentation for a detailed list available config options and sample templates you can adapt to your environment.
Try The Docker Demo
The NGINX One Docker Demo provides a working setup of Moesif and NGINX One. You can observe how the integration works and how Moesif captures analytics data and makes them available in real time. This allows you to evaluate before proceeding with an integration into a live environment.
Key Metrics to Track for API Analytics and Observability
Effective API observability hinges on the ability to track metrics that reveal not just whether an API is functioning, but how it performs, who it impacts, and where you need to perform optimizations. Let’s go through some examples to understand how Moesif makes it easy to obtain these metrics:
Latency Distributions (P95, P99)
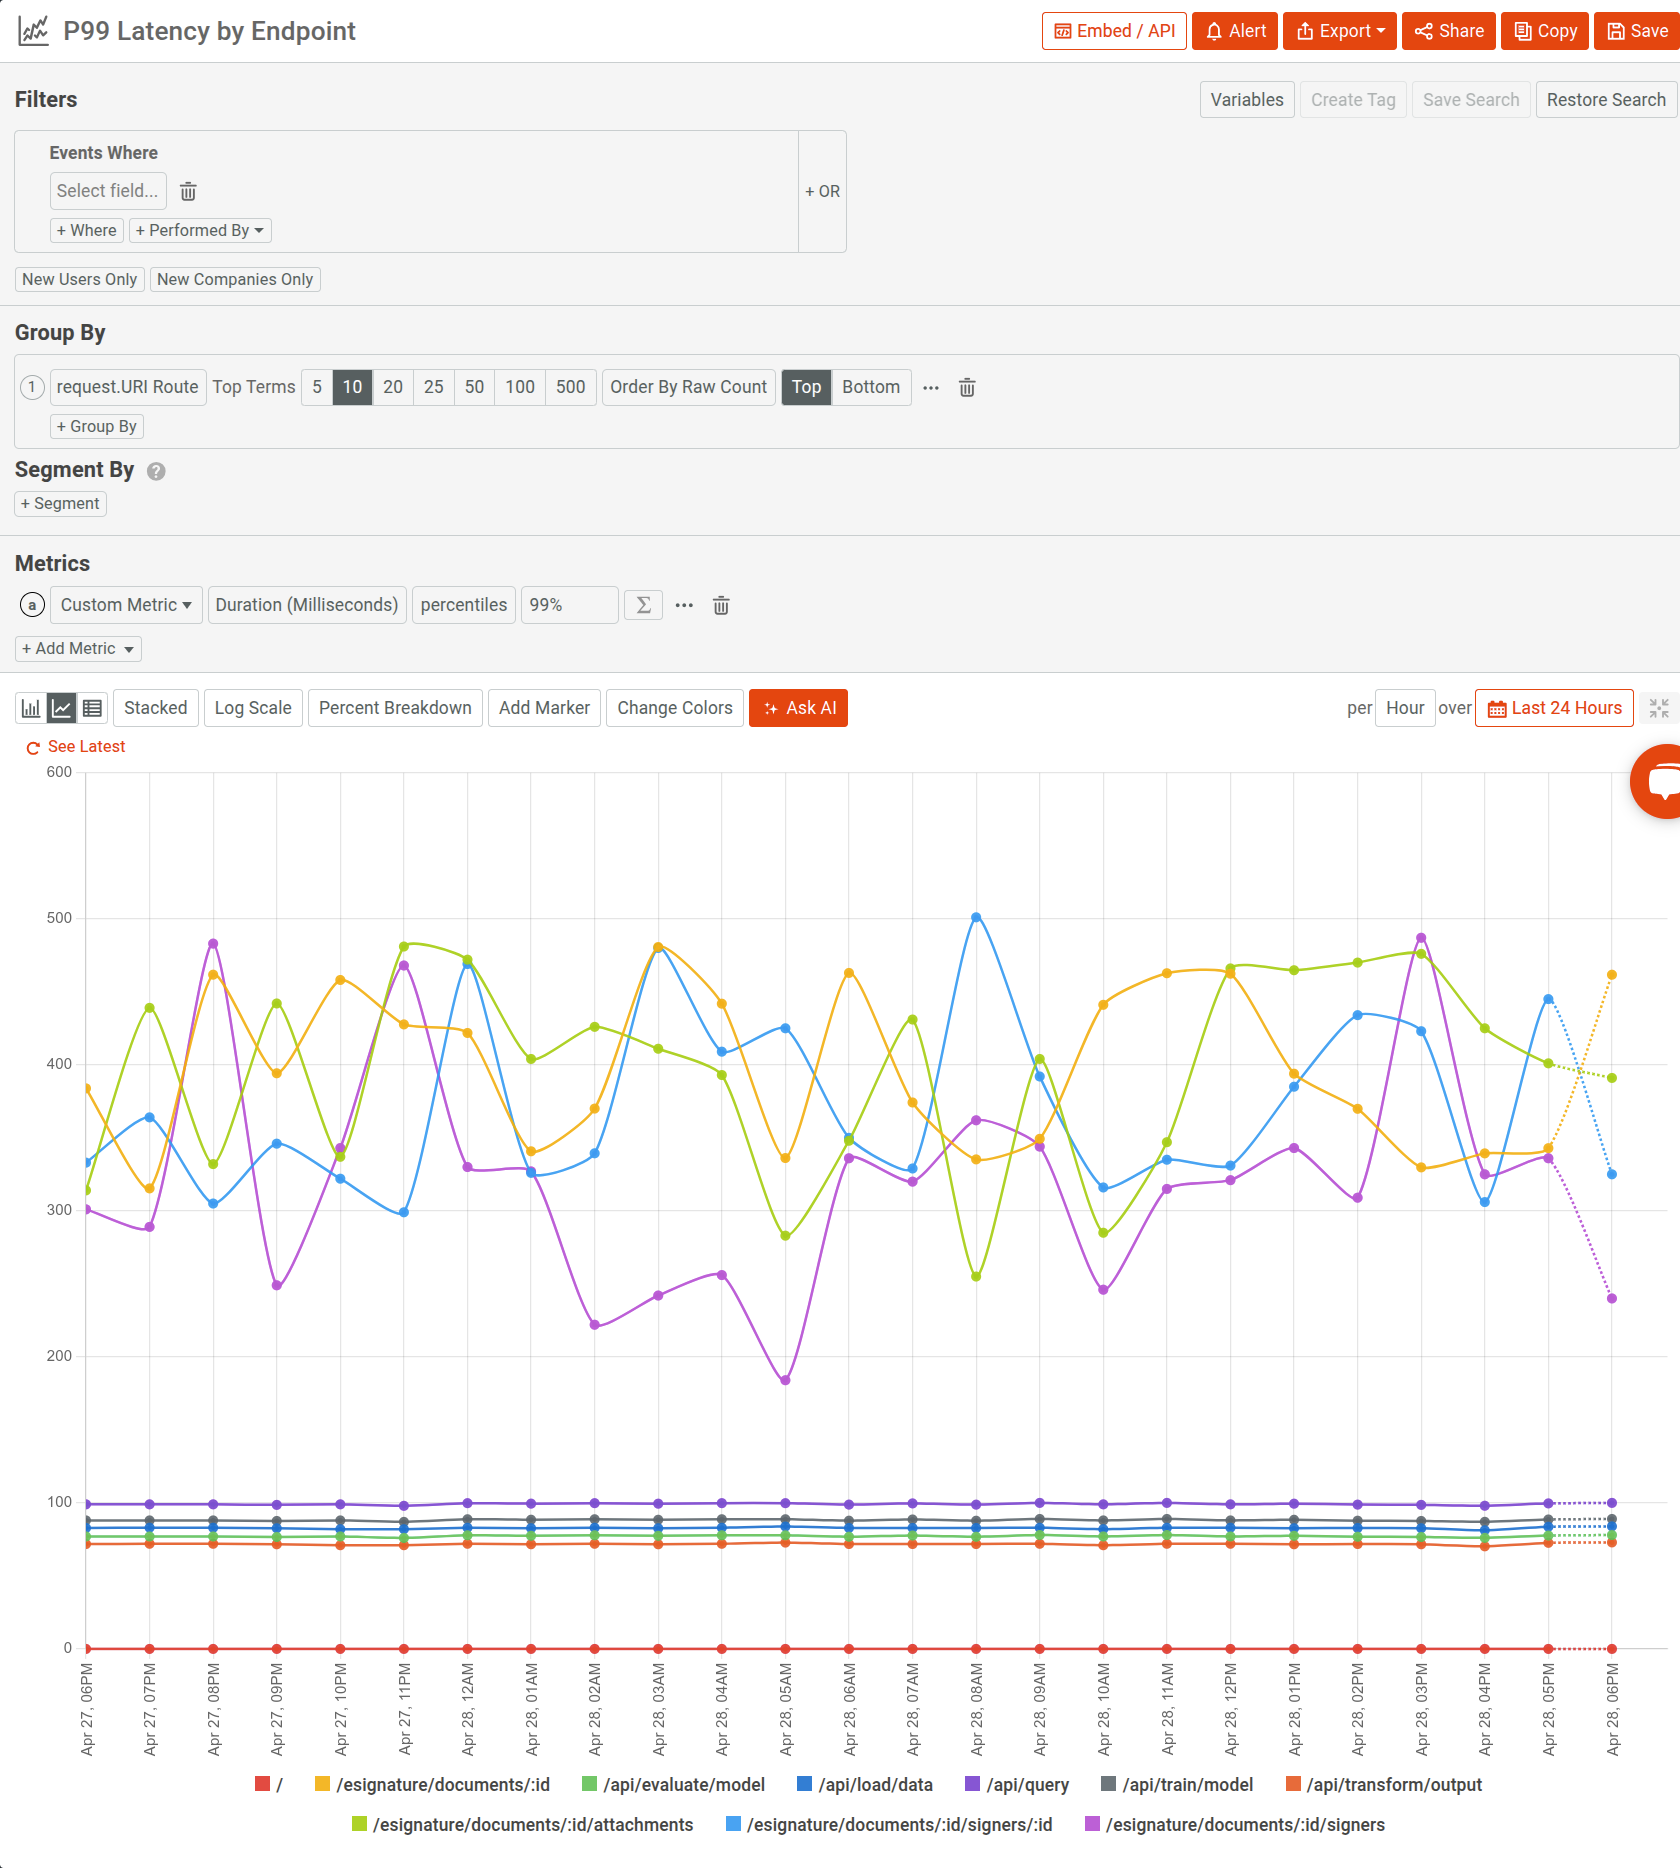
Latency metrics help distinguish between average performance and tail latency issues that degrade user experience. Using Moesif, you can break down response times into percentiles, allowing teams to see:
- The median latency (P50)—a general health indicator
- The long tail (P95/P99)—which highlights rare but critical slowdowns
The following analysis in Moesif computes a P99 latency analysis using a Time Series.
Error Rate by Route, Segment, or Plan
Basic counts of 4xx or 5xx errors don’t tell the whole story. Moesif allows you to:
- Segment API errors by status code, route, API version, or SDK
- Track error rates per customer or plan
- Identify spike patterns and correlate them with recent deployments
For example, a sudden rise in 401s on a specific route may indicate an expired token issue or auth regression.
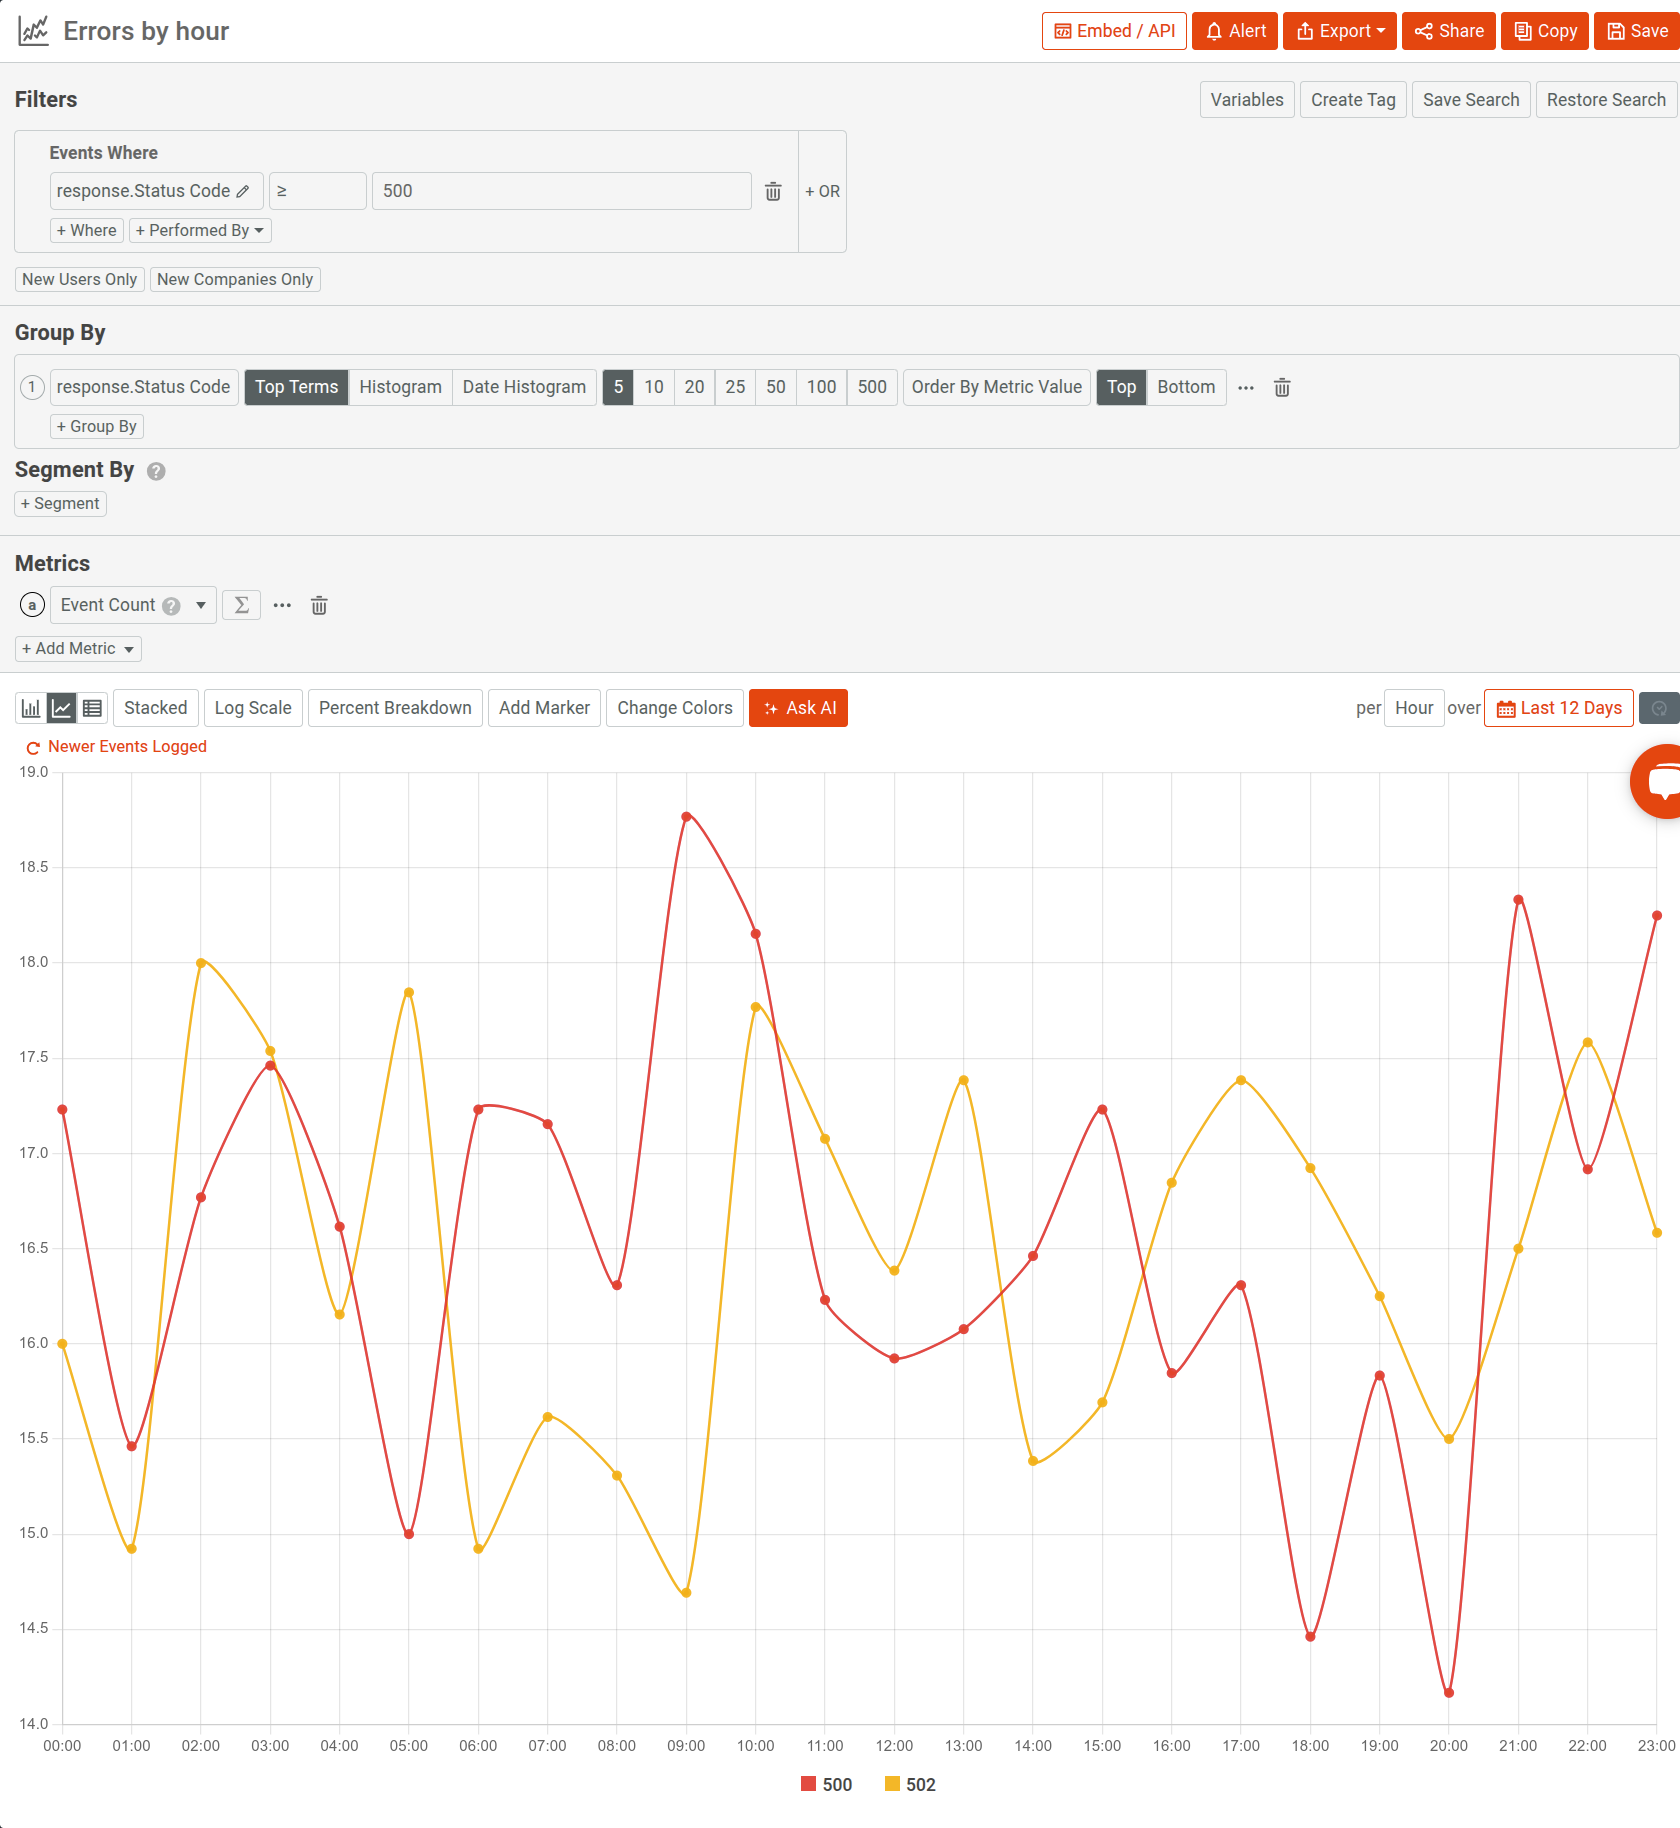
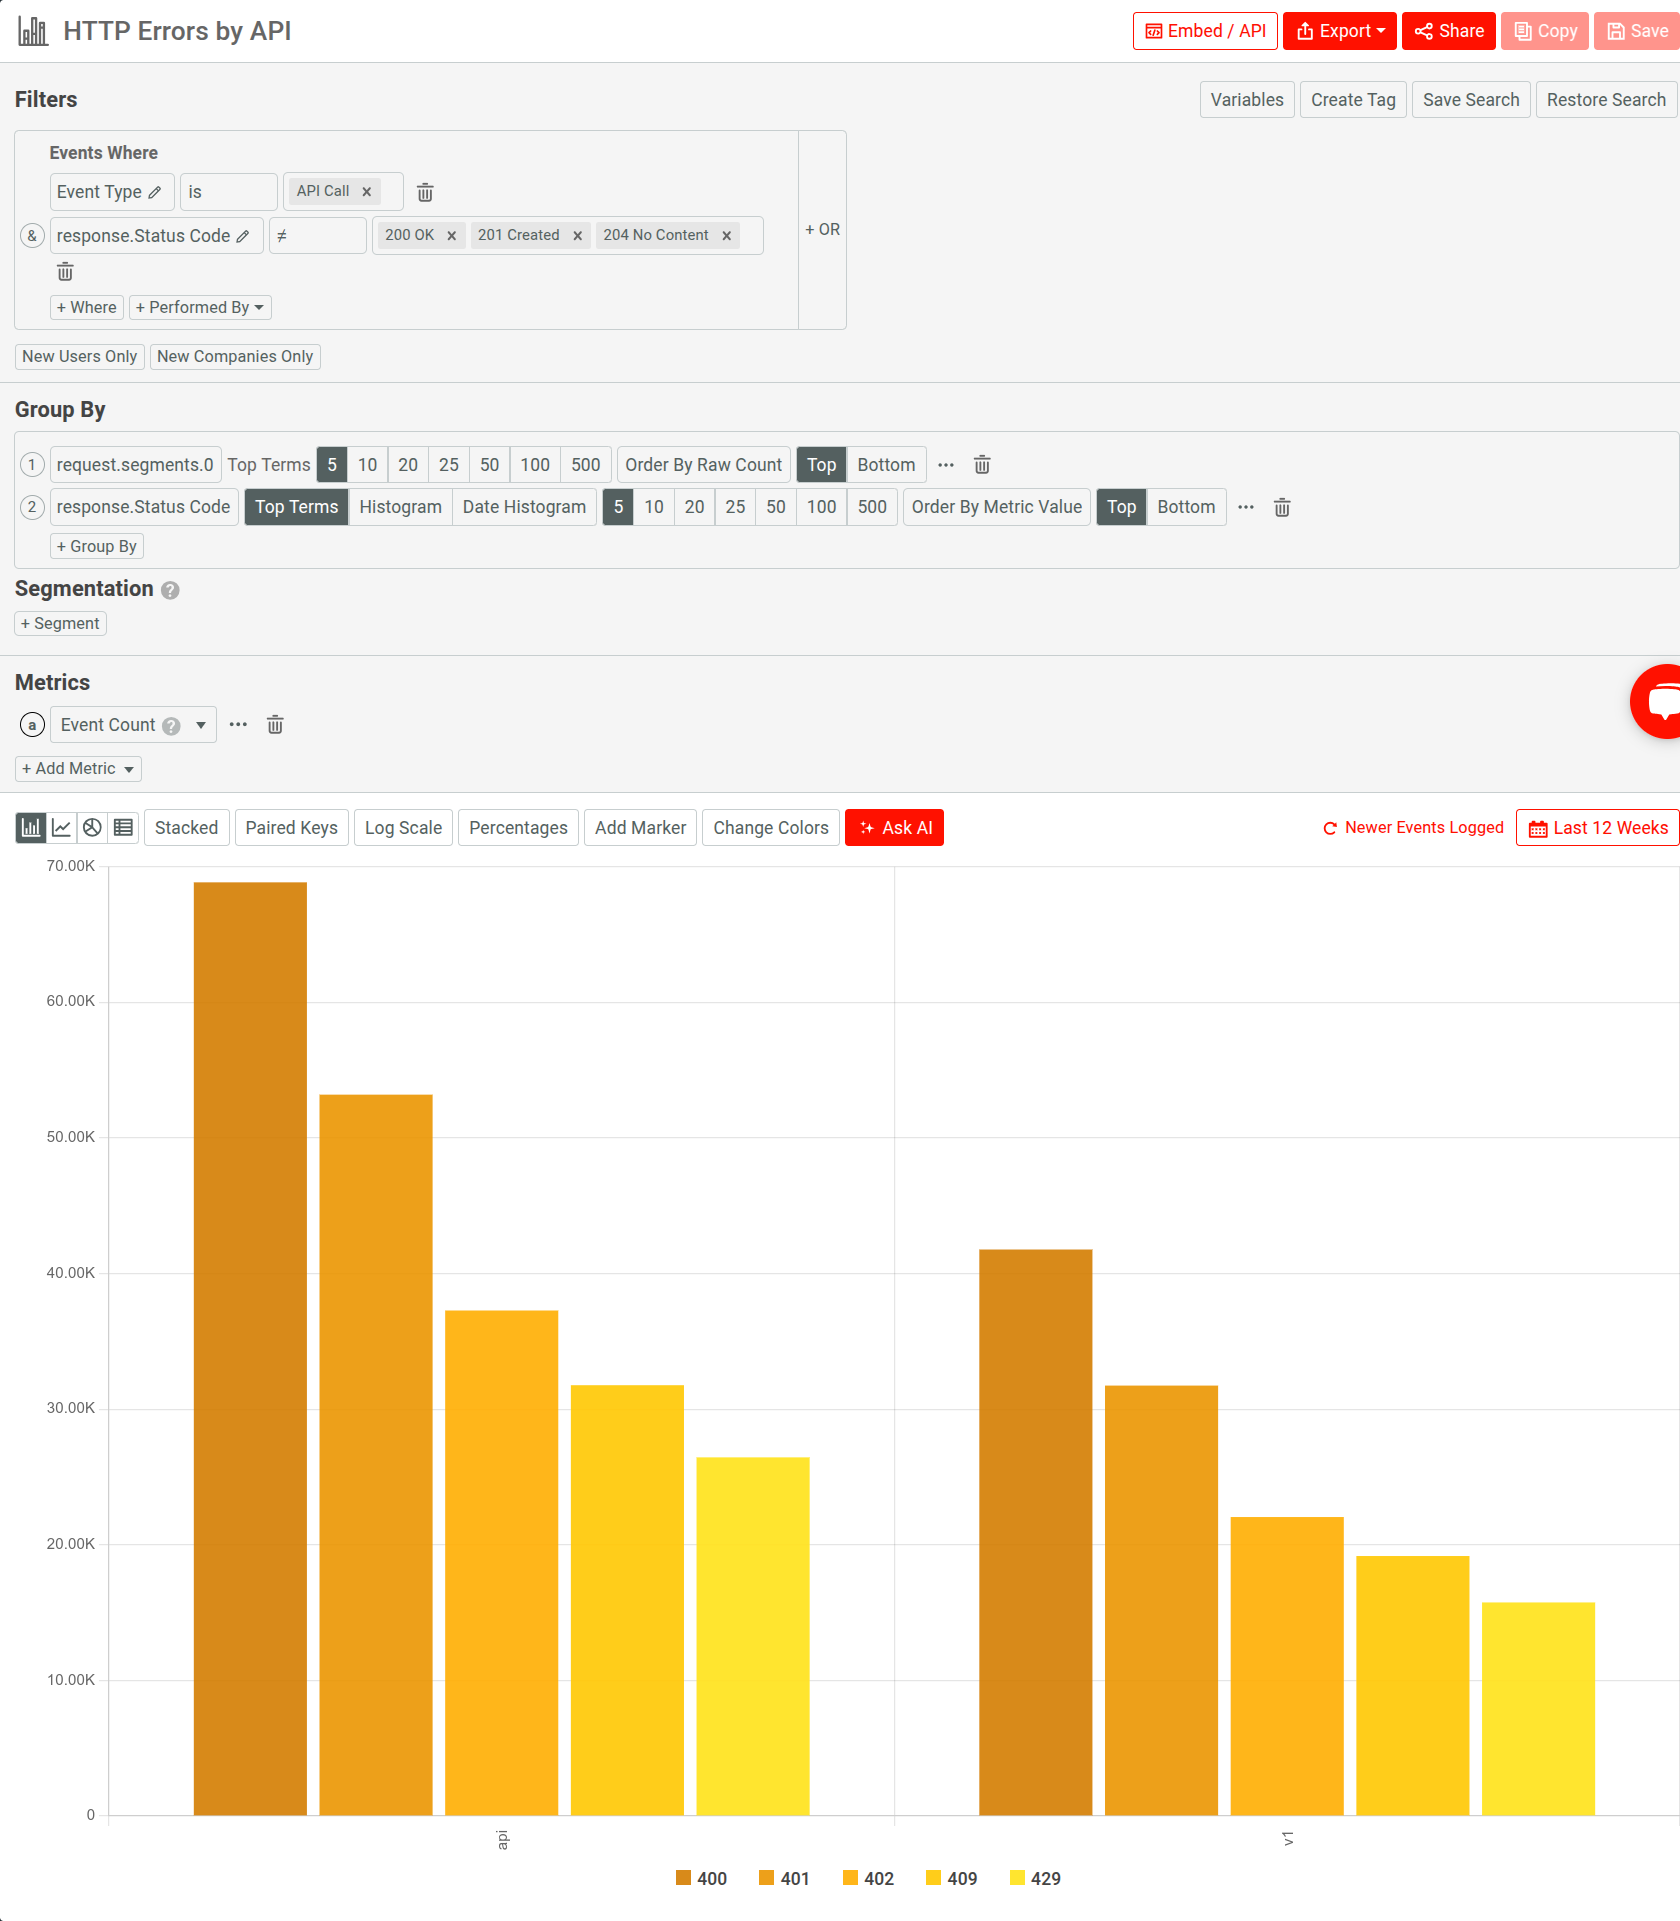
Let’s look at two examples in Moesif:
- Analyzing hourly error rate of
5xxserver errors over the past 12 days using Time Series - Breaking down error types in the last 12 weeks using Segmentation
User Activity and API Usage Patterns
With Moesif, you’re tagging your customers with user and company IDs at the gateway level. As a result, blunt request totals into sharp engagement insight—active-user curves by day, week, and month. You can also investigate user journeys and session flows. For example:
- Identifying how many unique users actively call the API each week.
- Locating where new users succeed or struggle during their first API interactions.
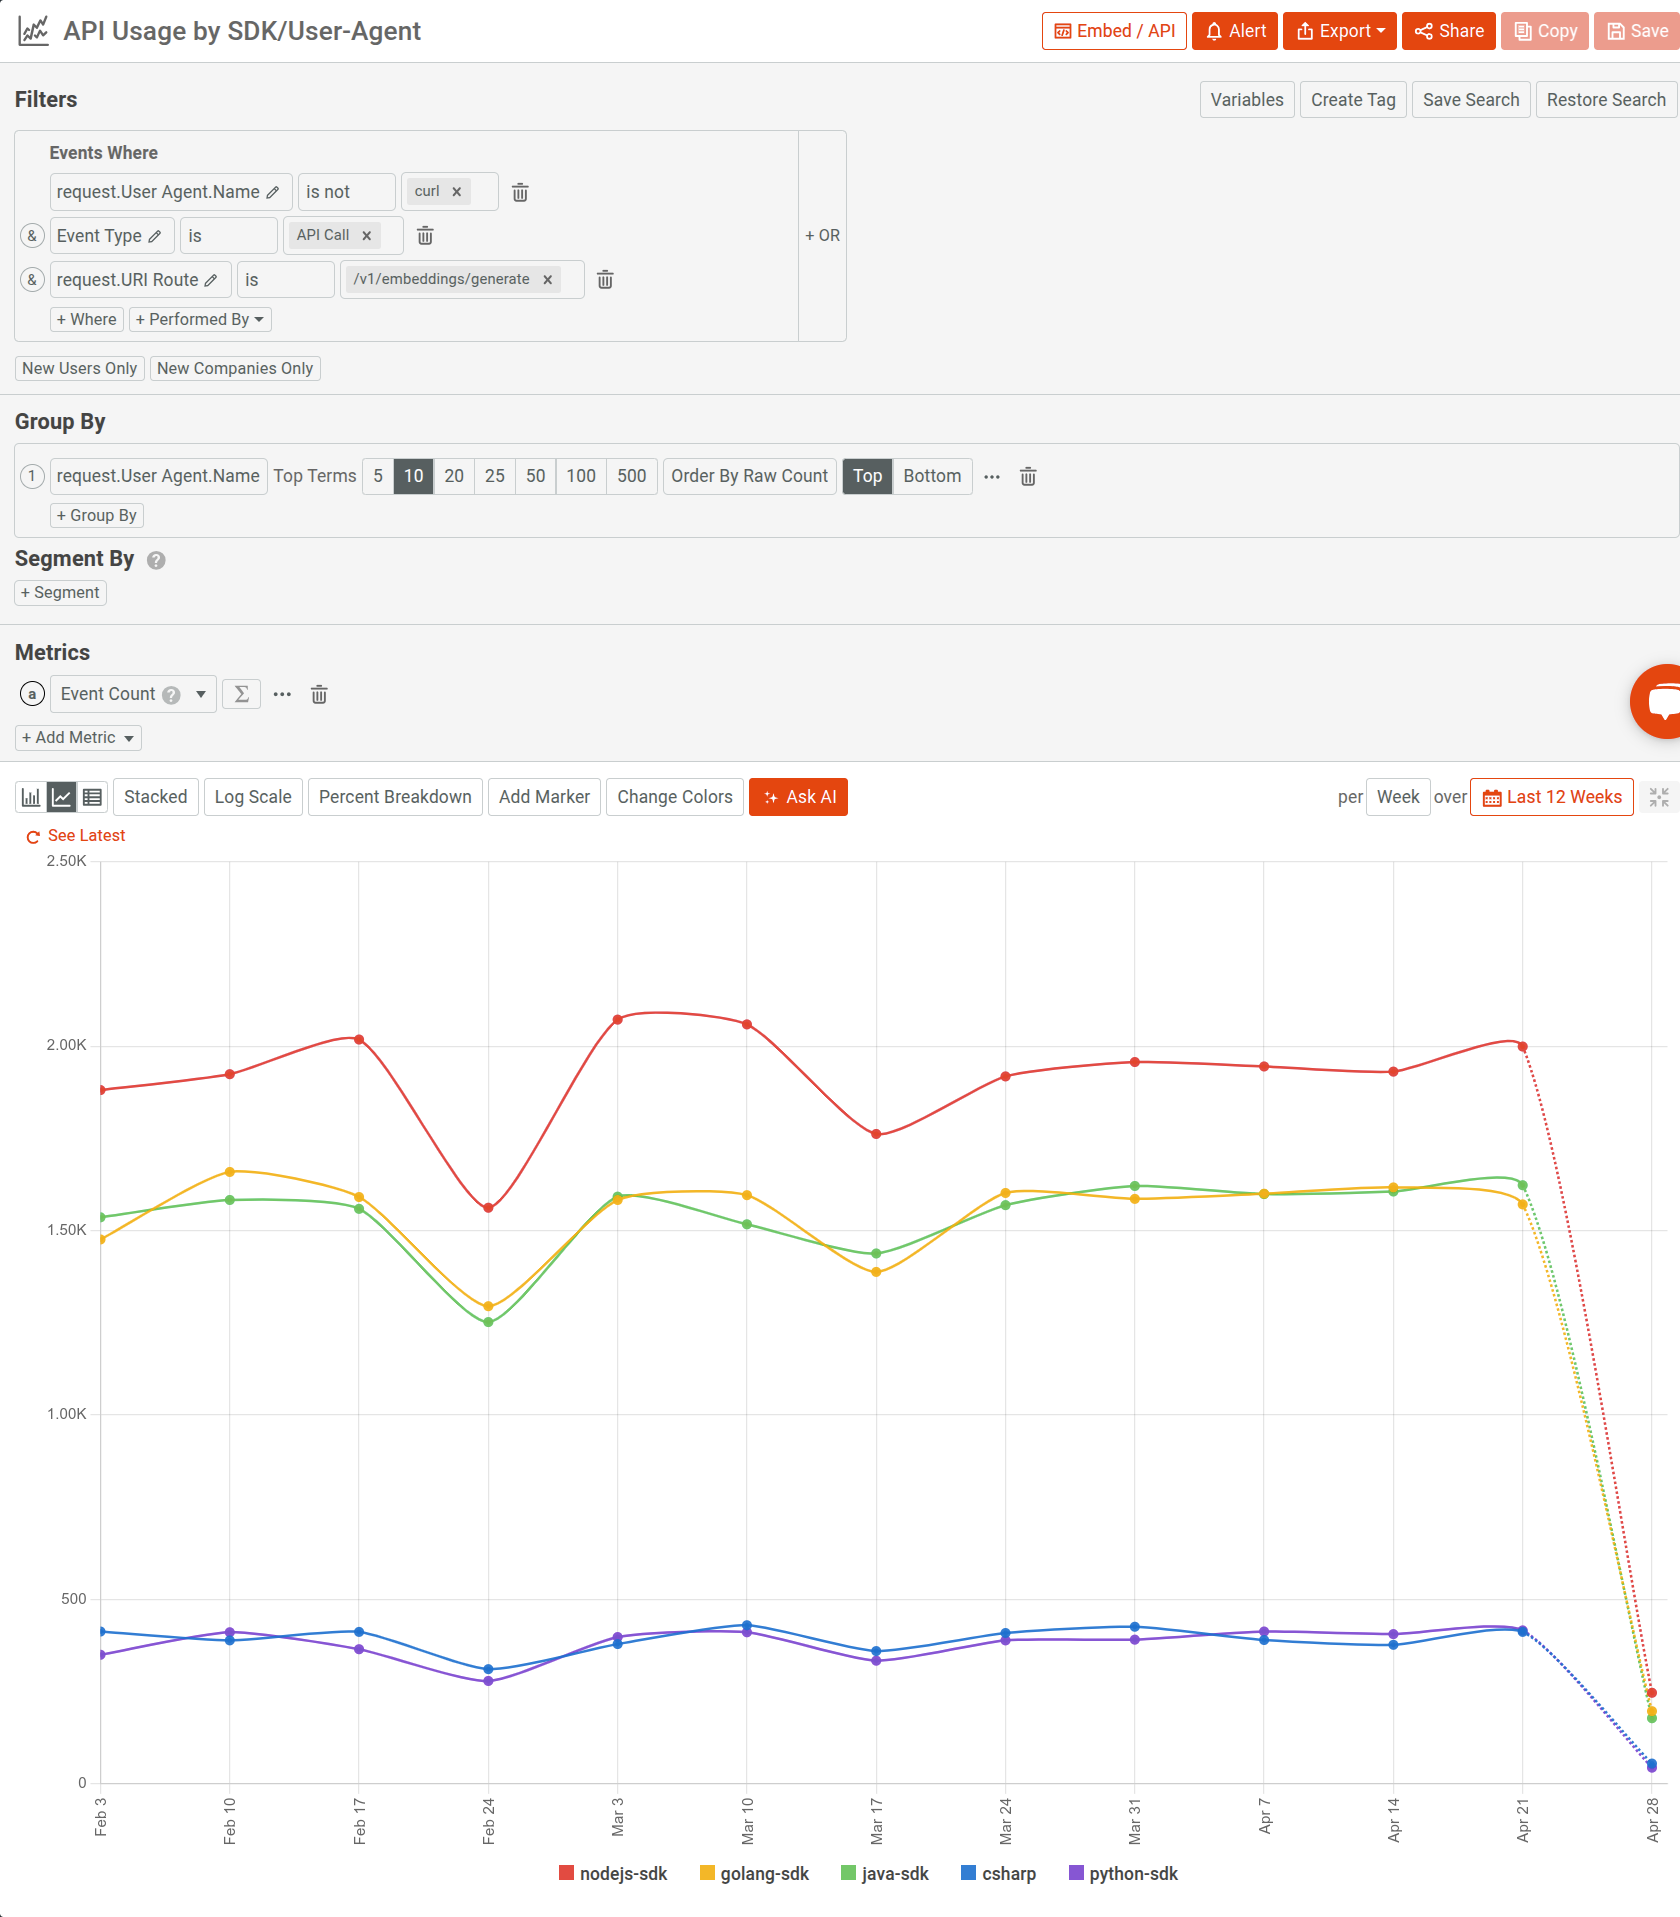
You can even group API calls by user agent to see which of your SDKs or CLI tools are driving most API traffic. As an example, here we analyze an embeddings API’s usage across different user agents and SDKs using a Time Series:
API Call Volume and Traffic Trends
Request volume reveals product adoption patterns and API usage trends. Moesif allows you to:
- Track calls per endpoint, SDK, or region
- Detect traffic anomalies, like sudden spikes from a bad deploy or usage drop from a broken client
- Analyze time-series trends (per minute, hour, day) to predict scaling needs
- Analyze usage change following a product launch, SDK release, or API version update
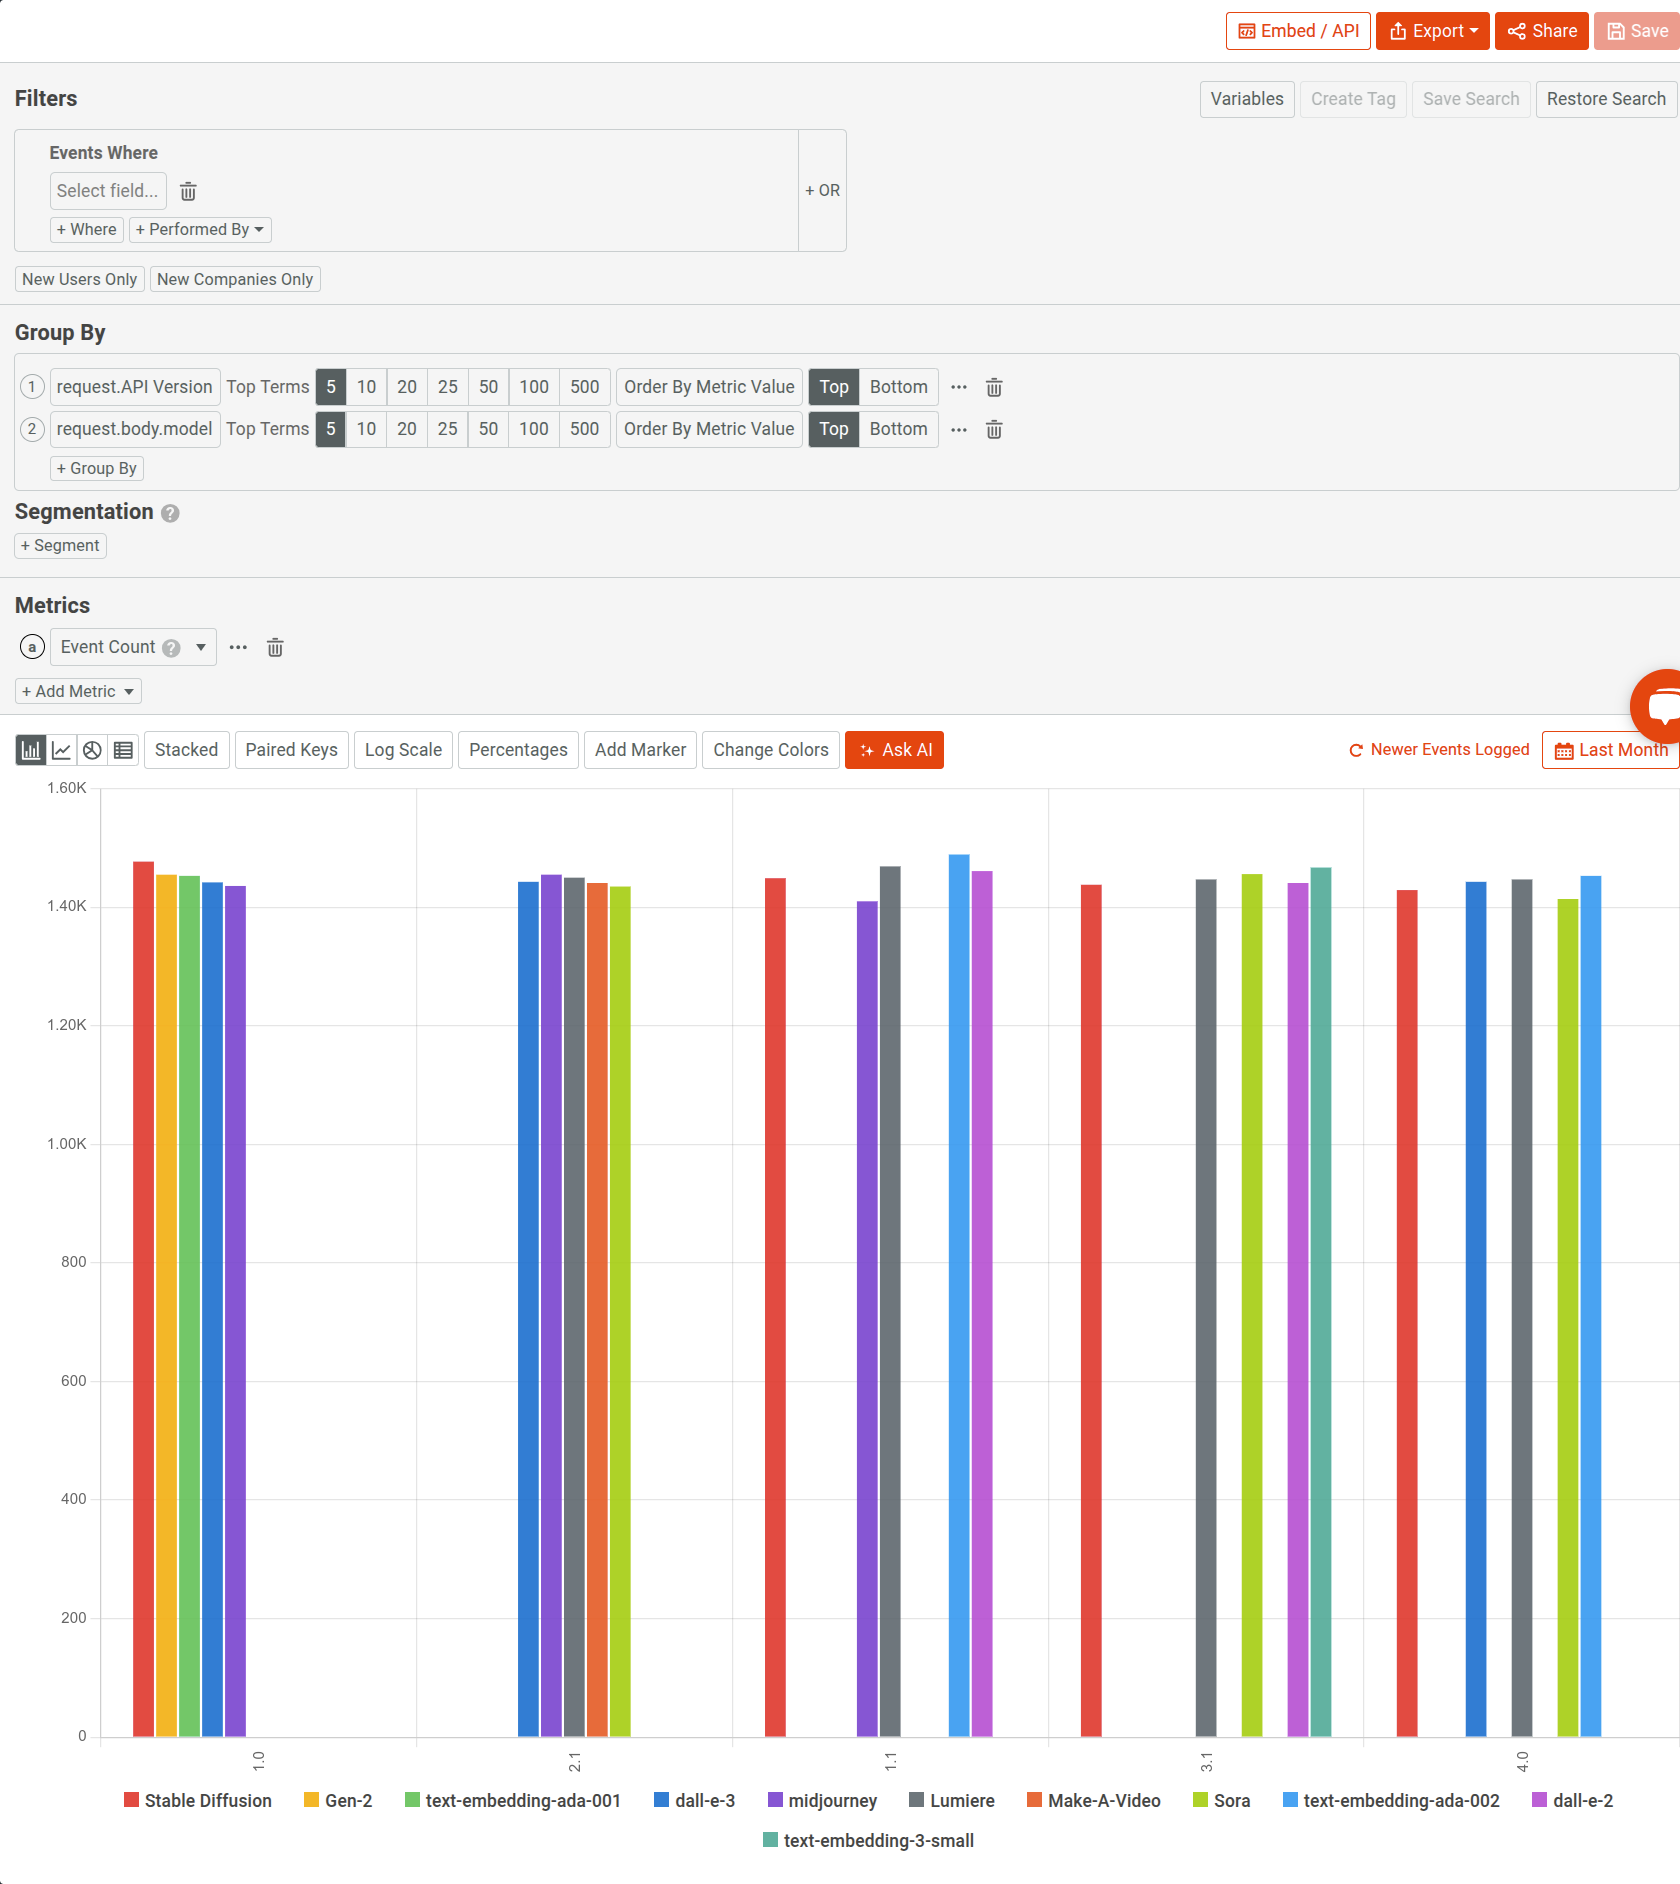
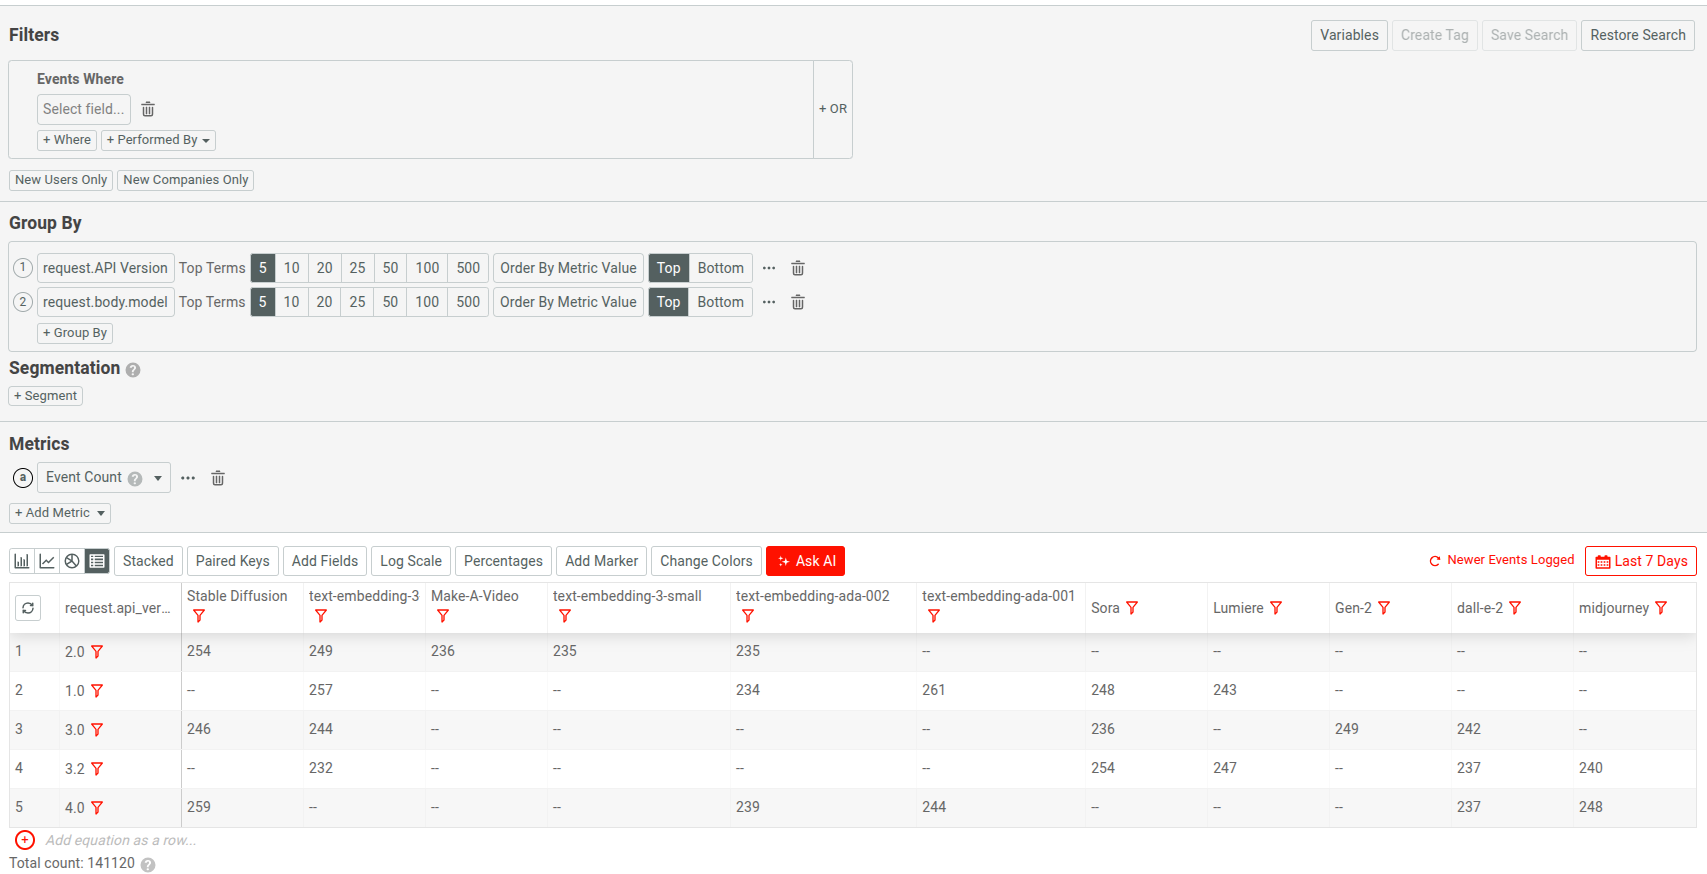
The following two Segmentation charts illustrate traffic volume across API versions and different models in an AI API product using:
- First we visualize the analysis in a bar chart
- Then we display the data in tabular form
Conclusion
Modern APIs require visibility into how they’re used and who they serve. By combining NGINX One’s infrastructure management with Moesif’s deep API analytics, you can establish a full-fidelity observability system that accelerates debugging, improves customer experience, and reveals real usage patterns. As APIs scale and customer expectations rise, having this level of visibility can make a measurable difference—both in day-to-day operations and long-term planning.


