Moesif + Gloo Gateway: Deep API Analytics and Observability at the Edge
Solo.io Gloo Gateway gives teams a reliable way to secure, route, and monitor API traffic in real time. With its high-performance Envoy core and Kubernetes-native design, it meets the demands of distributed applications and modern service architectures.
However, performance metrics alone don’t reveal how developers engage with your APIs or why adoption stalls. Gateway-level logs may confirm an endpoint works, but they don’t explain underused features, where onboarding breaks down, or what patterns drive retention.
That’s where Moesif compliments Gloo’s strength. By combining Gloo Gateway’s real-time traffic control with Moesif’s deep API analytics, your team can gain both operational visibility and product-level insight. This article demonstrates how this integration helps engineering and product leaders debug faster, improve developer experience, and drive smarter decisions through accessible data.

What is Gloo Gateway?
Gloo Gateway is a Kubernetes-native, “next-generation” API gateway engineered for performance, extensibility, and operational consistency across environments. It builds on Envoy Proxy, and has been designed to integrate with the Kubernetes Gateway API. By doing so, Gloo helps platform teams standardize how they expose, secure, and manage API traffic across services and clusters.
Its declarative configuration model and support for enterprise features like rate limiting, JWT validation, and function-level routing make it ideal for managing modern API workloads at scale. Irrespective of your use case—serving public APIs, internal microservices, or hybrid apps—Gloo Gateway provides the control and reliability to meet production demands.
While Gloo delivers extensive metrics for traffic health and behavior, Moesif, on top of that, can provide a complementary lens on user interaction and product-level trends. Gloo directs and secures your API traffic, while Moesif analyzes who is using your API and how. This allows you to better align infrastructure performance with broader product and developer experience goals.
What is Moesif?
We have built the Moesif platform to help teams understand how their APIs are used, by whom, and why—because system health checks aren’t enough; you need business transaction intelligence.
Moesif graduates from simple pass/fail signals to providing the complete and high-fidelity record, with context, behind every transaction. It captures every API call, with metadata—including headers, payloads, status codes, and response times—and ties that data to users and companies in real time.
Unlike many tools that stop at infrastructure metrics, Moesif delivers product-level observability. You can track developer behavior across onboarding, integration, and retention stages. Metrics like Time to First Hello World (TTFHW), active API users, or drop-off points in usage funnels help teams identify where consumers succeed—or get stuck.
For engineering leaders, Moesif enables targeted debugging and precise root cause analysis with powerful event-based filtering, anomaly detection, and long-tail latency tracking. If you’re working in the product team, you have clear windows into which endpoints drive adoption and where to focus future improvements.
With lightweight integration options and real-time dashboards, Moesif fits cleanly into cloud-native environments—providing the kind of usage intelligence you need to shape better API products.
Using Moesif and Gloo Gateway Together for a Complete Observability Stack
Moesif’s integration with Gloo works through Envoy’s External Processing (ExtProc) interface. This allows Moesif to capture enriched API call data from Gloo in real time, without injecting latency or risking path stability. This section outlines how the integration unlocks visibility across three critical areas: real-time performance monitoring, developer experience, and usage-aware operations.
Real-Time Monitoring at the Edge, Without Trade-Offs
Moesif’s ExtProc plugin forwards request and response data to Moesif asynchronously as traffic flows through Gloo Gateway. This enables high-frequency logging without impacting throughput or introducing additional hop latency. More importantly, the integration runs out-of-band with configurable failover modes. Your production traffic stays free from any reliability risk.
This architecture, on top of Gloo’s infra metrics, gives teams access to detailed telemetry across every route and method, including:
- Latency distributions at high percentiles—like P95, P99—to catch tail-end degradations
- Time-series breakdowns by endpoint, method, or client ID
- Spike detection for both traffic surges and error responses
This conjunction makes request context always available for faster root cause analysis—and continuous monitoring for anomalies, error responses, and unexpected traffic behavior.
Linking API Calls to User Journeys
Moesif makes it possible to track how real users interact with your APIs by automatically capturing user and company IDs from request headers. You don’t need any changes in your backend services for Moesif to enrich API events with identity-aware context right at the gateway. You get a clear view into how customers experience your APIs over time.
You can trace signals back to specific users, bringing a product analytics lens to API traffic:
- Monitor onboarding success with metrics like TTFHW.
- Analyze when users drop off in common integration paths.
- Identify underused endpoints or features across customer segments.
- Visualize usage funnels and conversion stages
- Detect recurring friction points like spikes in
401s during auth workflows. - Track retention and segment behavior by SDK, plan tier, or customer vertical
Platform owners can easily distinguish between technical failures and user-facing usability gaps.
For more information on how customer identification works, see Identifying Users and Companies in Gloo Gateway.
Analytics That Drive Operational and Product Decisions
Moesif turns traffic patterns into decision-ready data for both engineering and product leaders. You can leverage dashboards and reporting tools to define KPIs across availability, adoption, and engagement—all in a way that’s sharable and aligned across functions.
For example:
- Identifying the top API methods and endpoints by traffic and error rates.
- Filtering by SDK to prioritize developer tooling investments.
- Detecting sudden drops in activity that might signal integration issues.
- Correlating response time regressions with user impact.
Setting up Moesif with Gloo Gateway
Follow the integration guide to get started. The documentation contains examples, configuration options, and usage instructions to further help you adjust your setup.
Since Moesif integrates with Gloo through Envoy’s External Processing (ExtProc) filter, traffic data streams to an external gRPC service. Moesif provides a lightweight ExtProc-compatible service that you can deploy as a standalone Kubernetes pod within your environment. The service receives API call data from Envoy and asynchronously forwards it to Moesif.
Live Monitoring and Operational Metrics
Moesif extends Gloo’s built-in metrics with live, high-resolution telemetry on how your APIs behave in production. For engineering teams managing uptime and SLAs, this translates to faster detection, clearer visibility, and more effective troubleshooting.
Here are some ways Moesif strengthens your operational observability at the gateway layer:
Track P95/P99 Latency By Endpoint
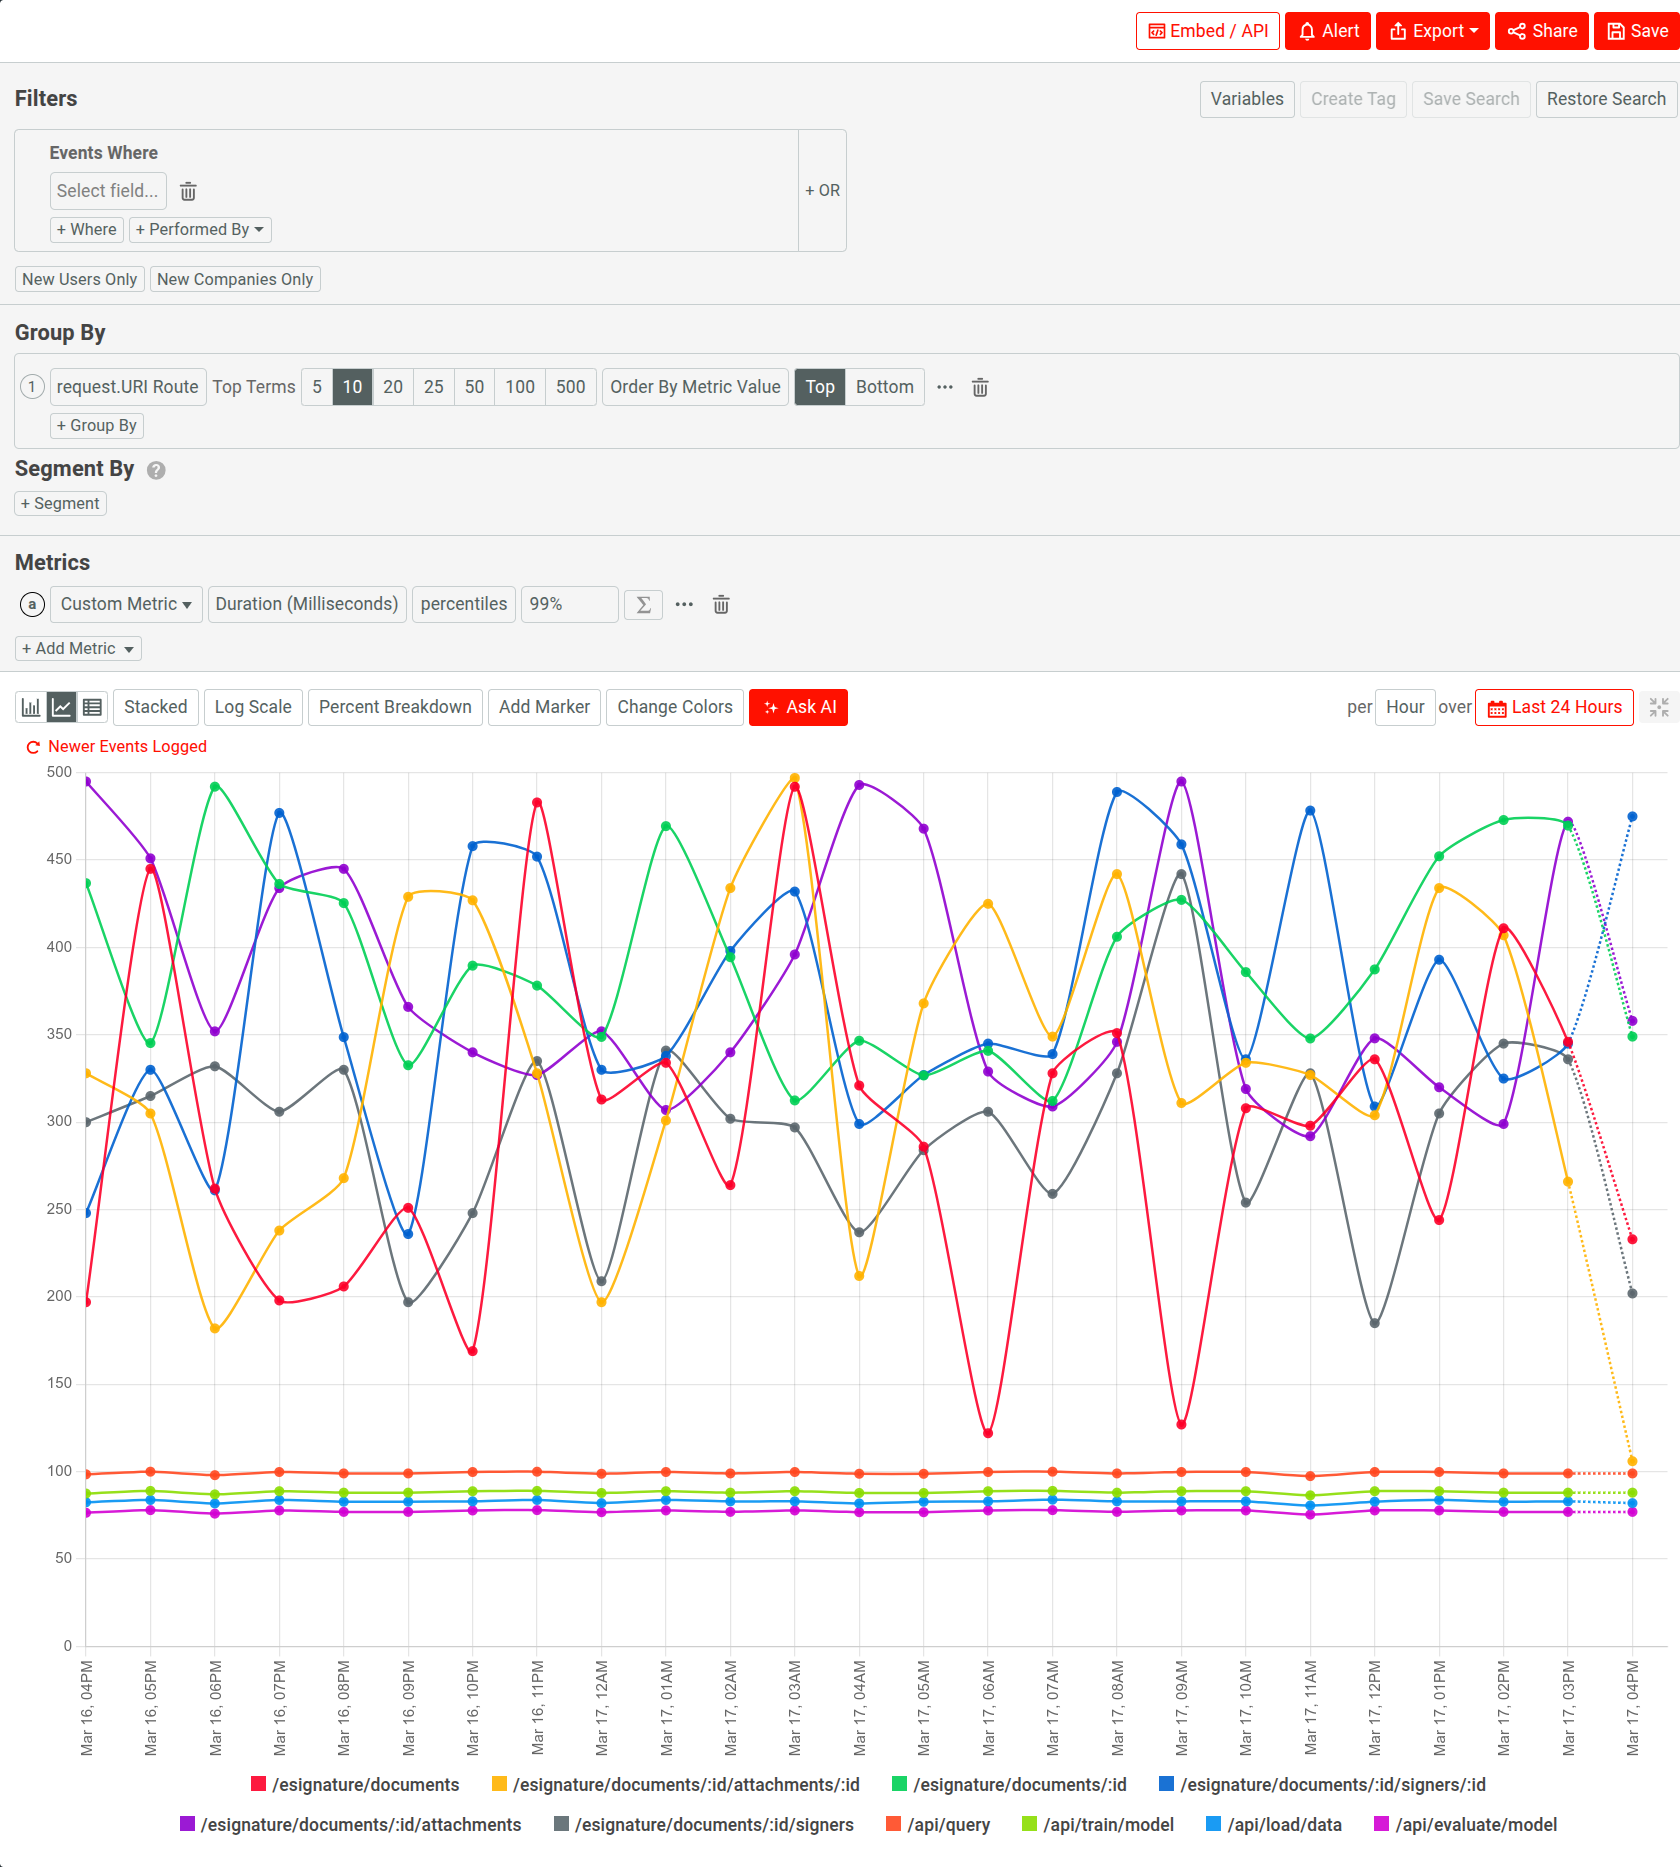
You can analyze latency percentiles in real time using Moesif. For example, if a login route maintains a 150ms median but spikes to 1.2s at P99 during peak hours, an average analysis will miss that.
In the following 24-hour span Time Series, we perform an hourly analysis to observe P99 latency across API endpoints:
Segment Error Responses Across Routes and Clients
By filtering 4xx and 5xx API errors by customer ID, API key, or SDK, you can pinpoint problematic patterns. For example, the following analyzes 5xx server error counts within the past 12 weeks, breaking down the analysis by response status codes:
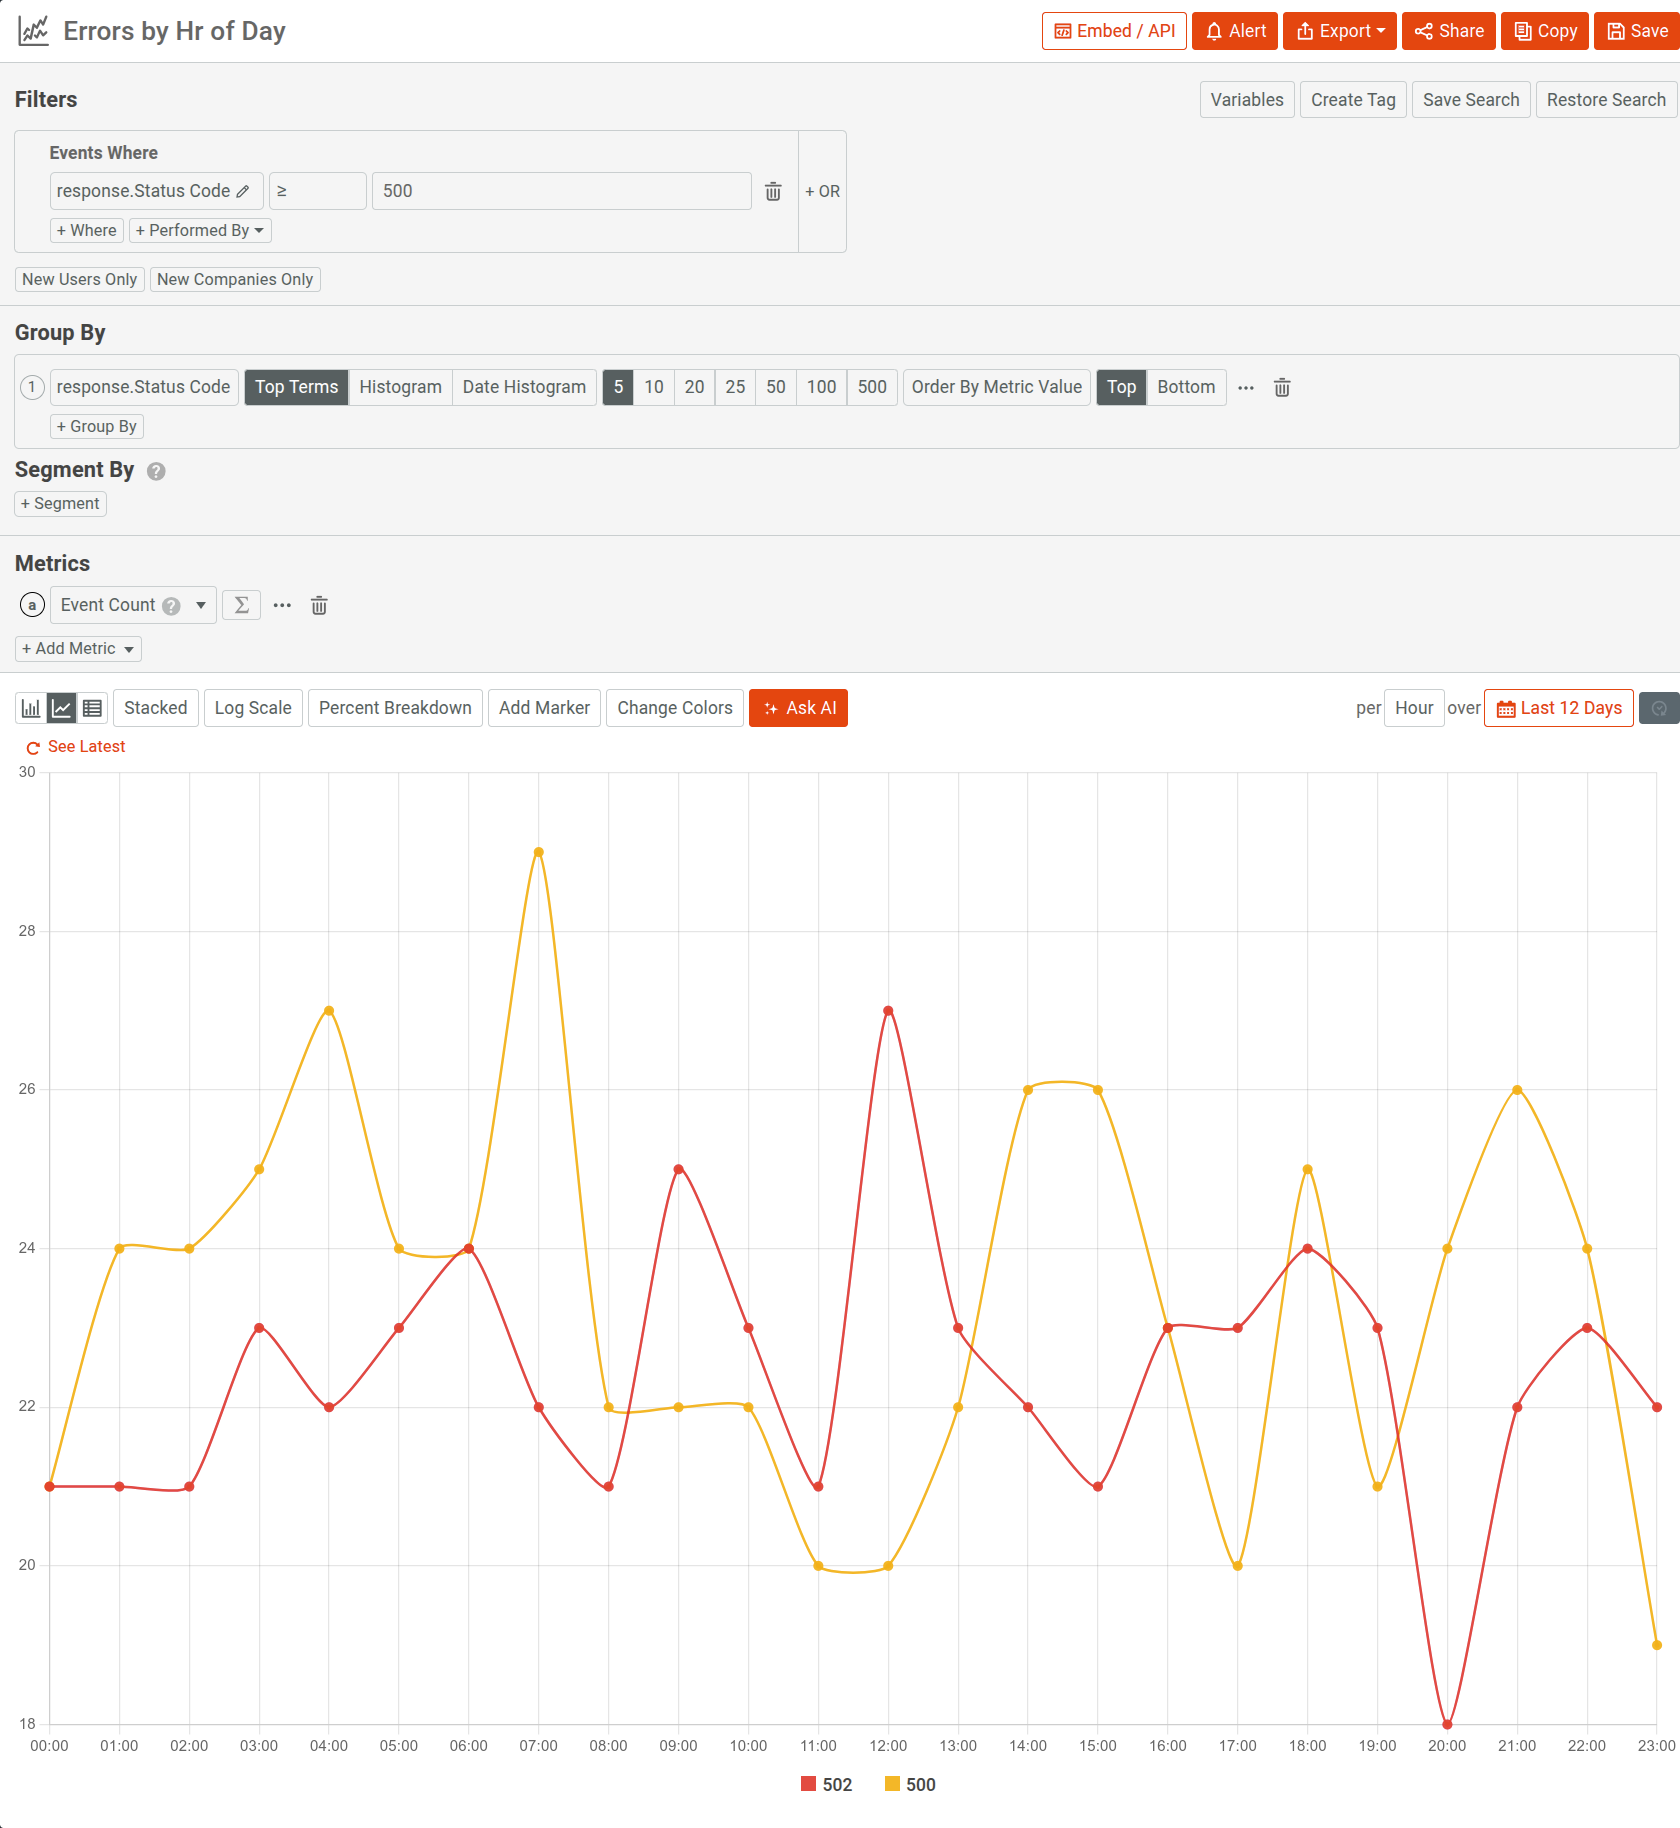
It also folds the time series (notice the grey activated button next to the analysis time period) to help visualize periodic patterns, making it easier to spot regular anomalies, such as spikes in error rates. By isolating specific time frames, you can pinpoint the worst-case scenarios and investigate underlying problems like:
- Performance bottlenecks when API usage reaches its peak.
- Service disruptions caused by routine maintenance or scheduled tasks.
- Recurring failures from external dependencies that occur at specific times.
Let’s look at another example that visualizes all error types:
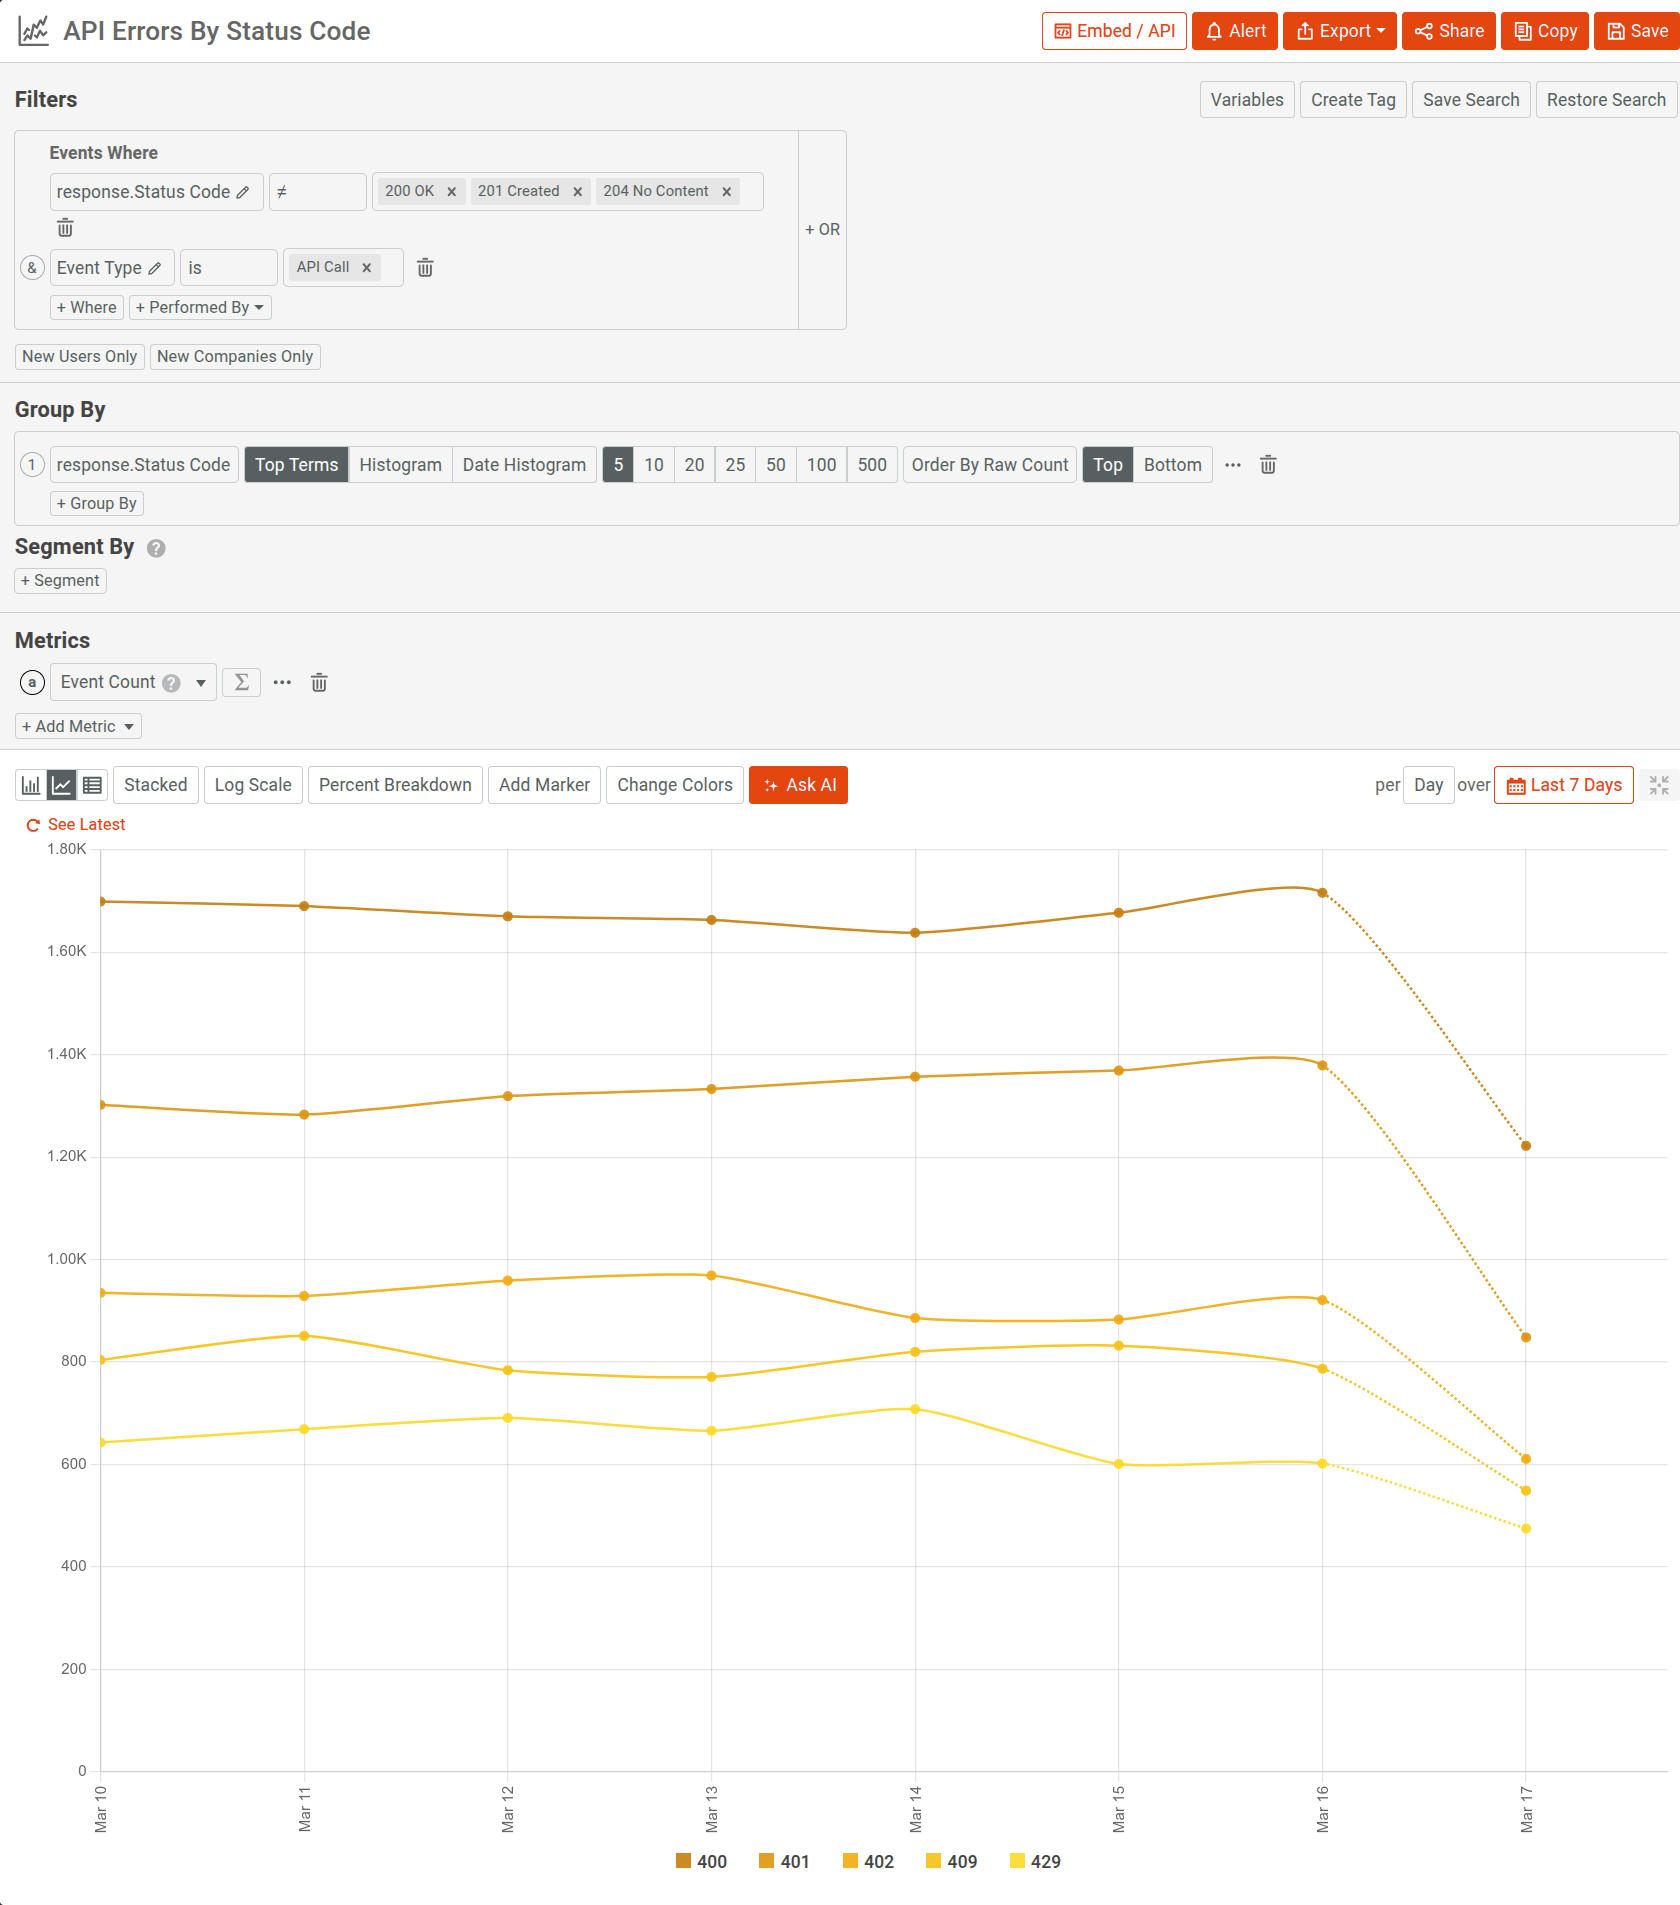
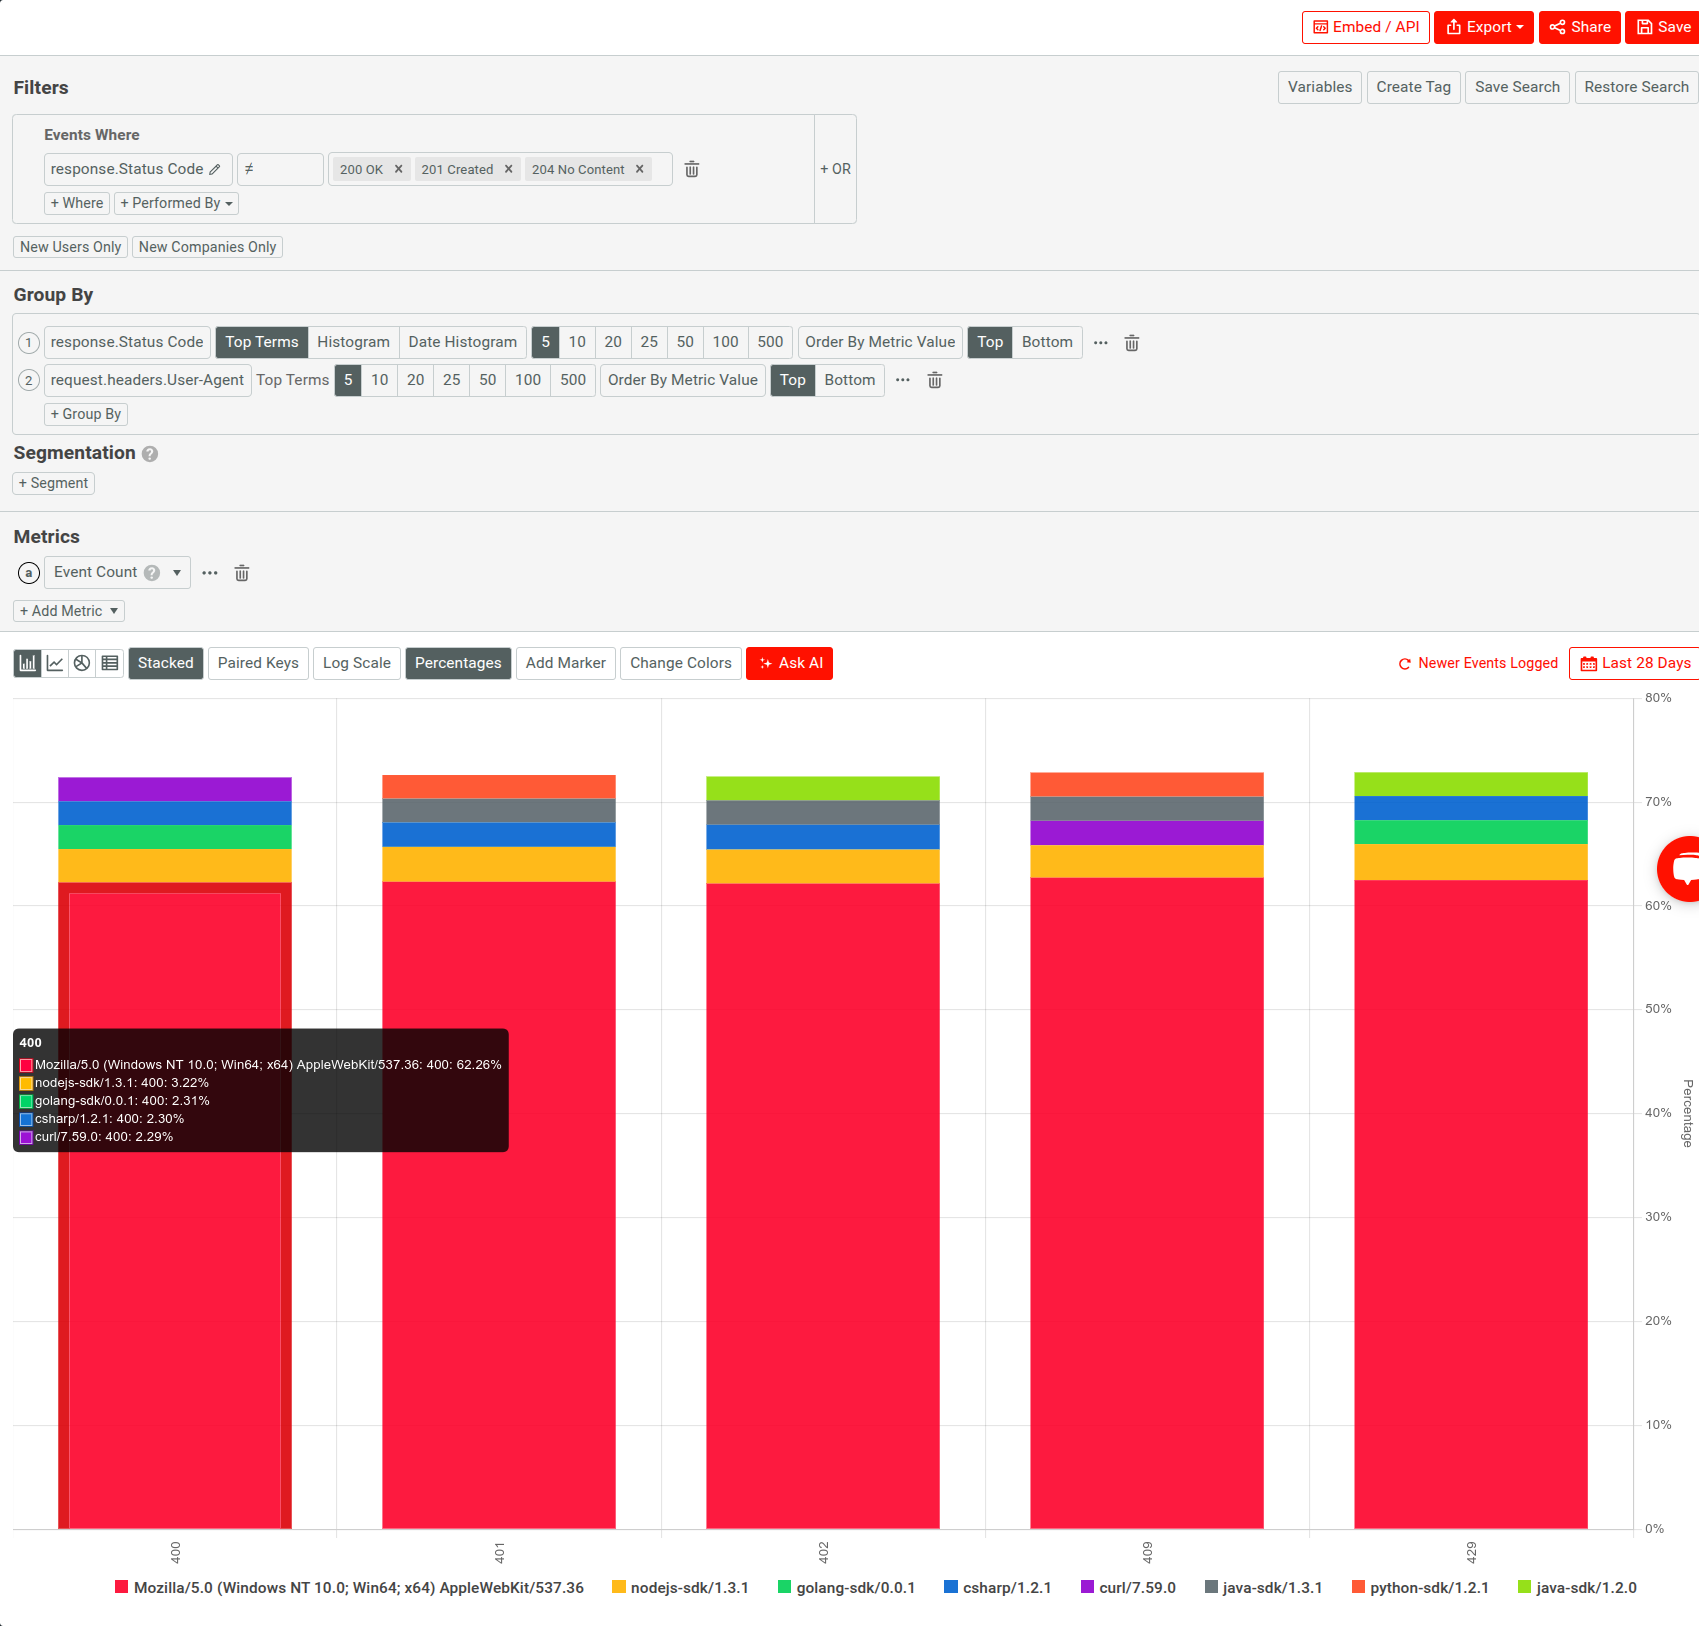
Being able to break down errors and contextualize them allows you to create error heatmaps to identify problematic parts of your product offerings. For example, the following Segmentation analysis uses two categories—response status code and SDKs, to break down errors. The result clearly illustrates the erroneous SDKs causing the most friction.
Product Analytics and Developer Insights
Linking API traffic with individual users and companies allows you to perform value-aligned product and customer analysis in Moesif. This gives product and platform teams the necessary behavioral signals to improve developer experience and API adoption.
Here are some ways teams use Moesif to drive product decisions with usage-level visibility:
Measure Onboarding Success
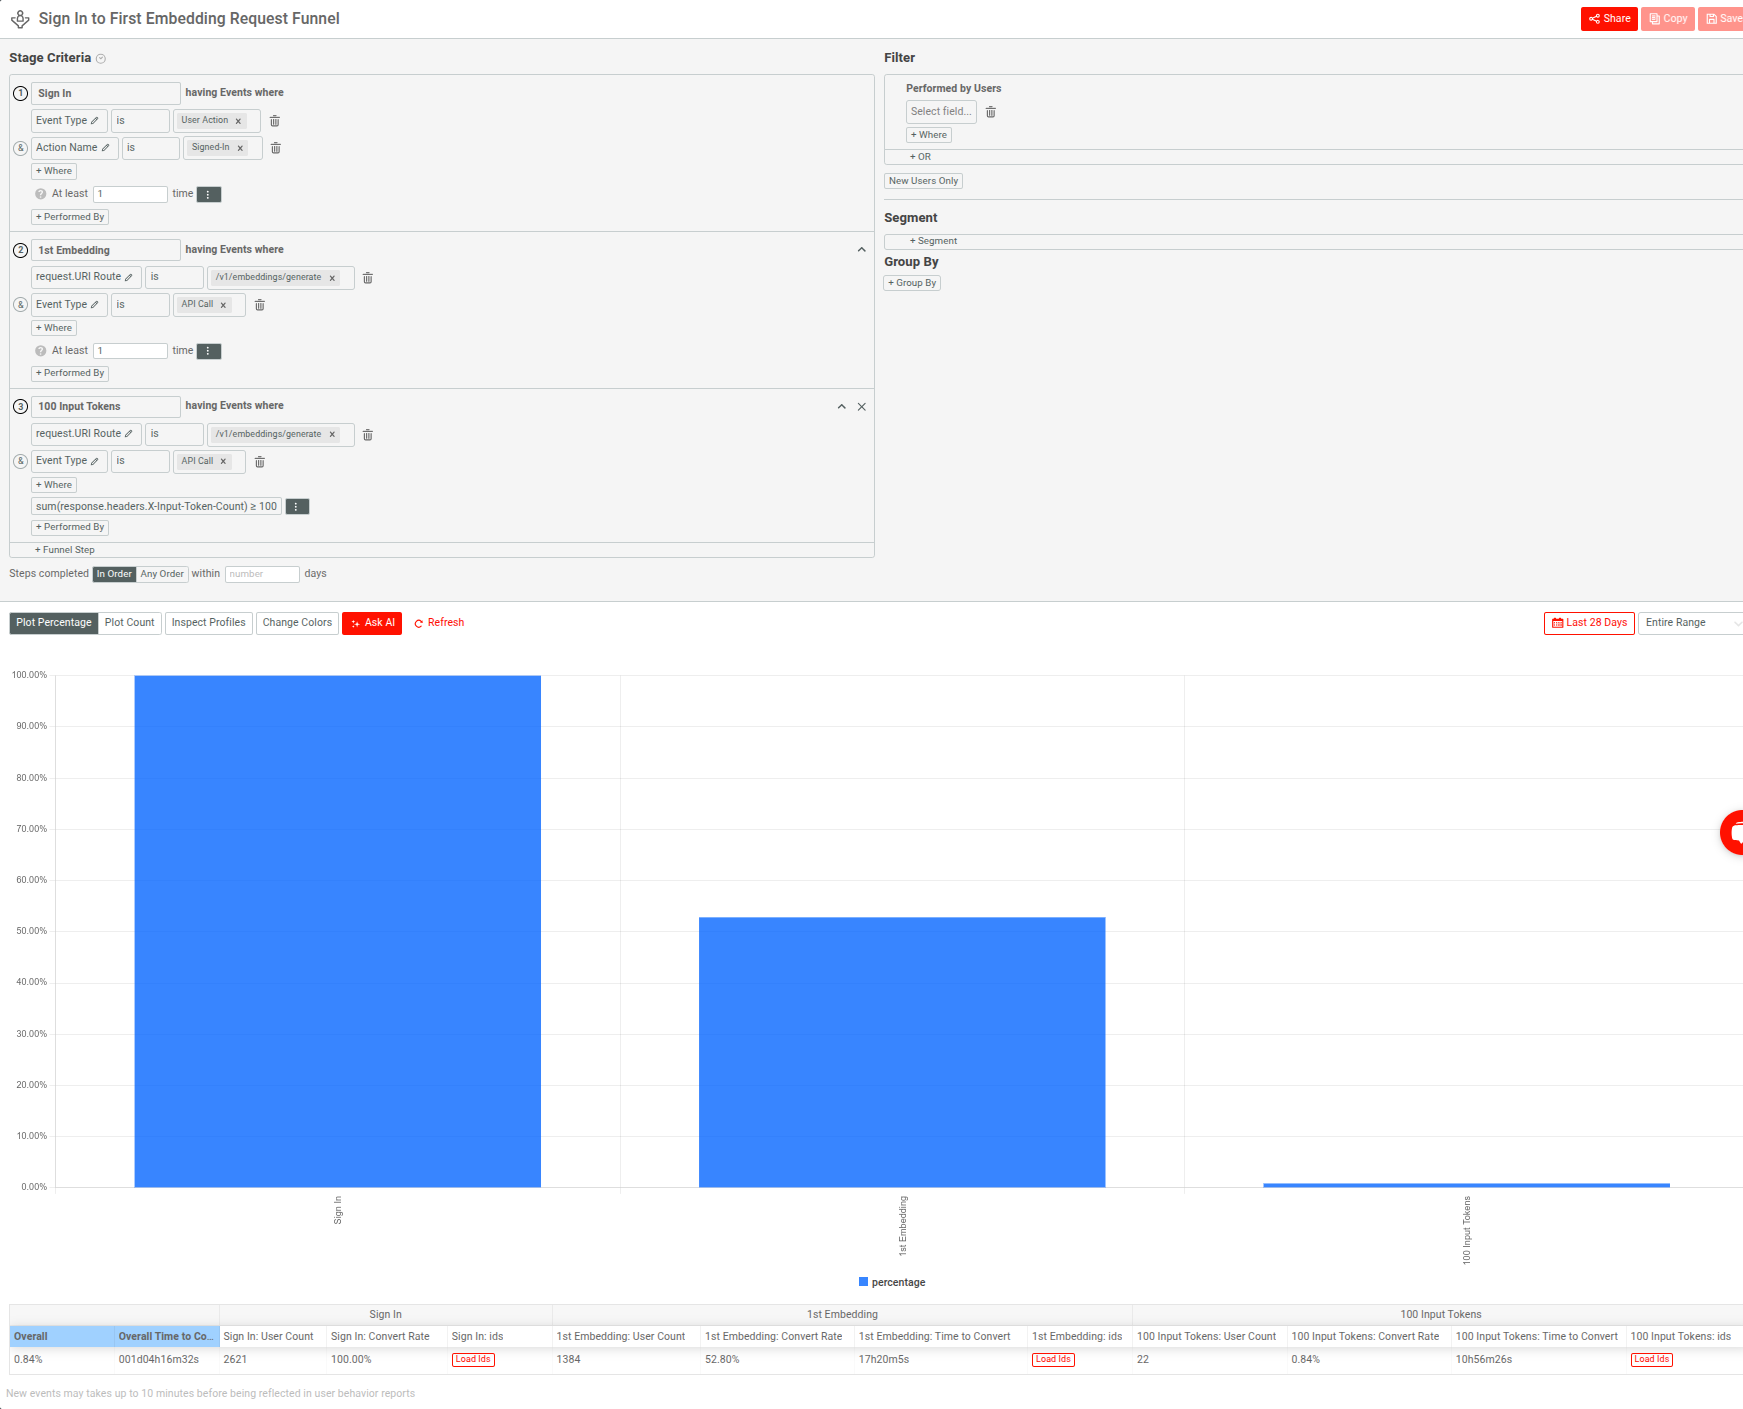
Tracking metrics like TTFHW can provide insights on the period of time developers need to make their first successful API call. If, for example, you observe that most drop offs occur before completing authentication, it might suggest a documentation or SDK usability issue, rather than an infrastructure one.
For example, here’s a funnel analysis in Moesif for a GenAI API, constituting of these steps:
- Signing in successfully
- First call to the embeddings endpoint
- Consuming more than 100 input tokens
Map Usage Funnels
Using funnels, you can go further to evaluate your product’s sustained usage. For example, if you have an AI API, you might define a multi-stage funnel like this:
- Generating model key
- First prediction
- Triggering batch inference
- Initiating feedback loop
If Moesif illustrates that many users stop after single predictions but never reach batch or feedback stages, it may indicate a number of issues:
- Unclear pricing
- Limited onboarding docs
- Undercommunicated API performance constraints
You can segment funnel drop-off by customer tier or SDK version to target improvements that reduce churn and support higher-value usage patterns.
Analyze Engagement, Adoption, and Popular Features
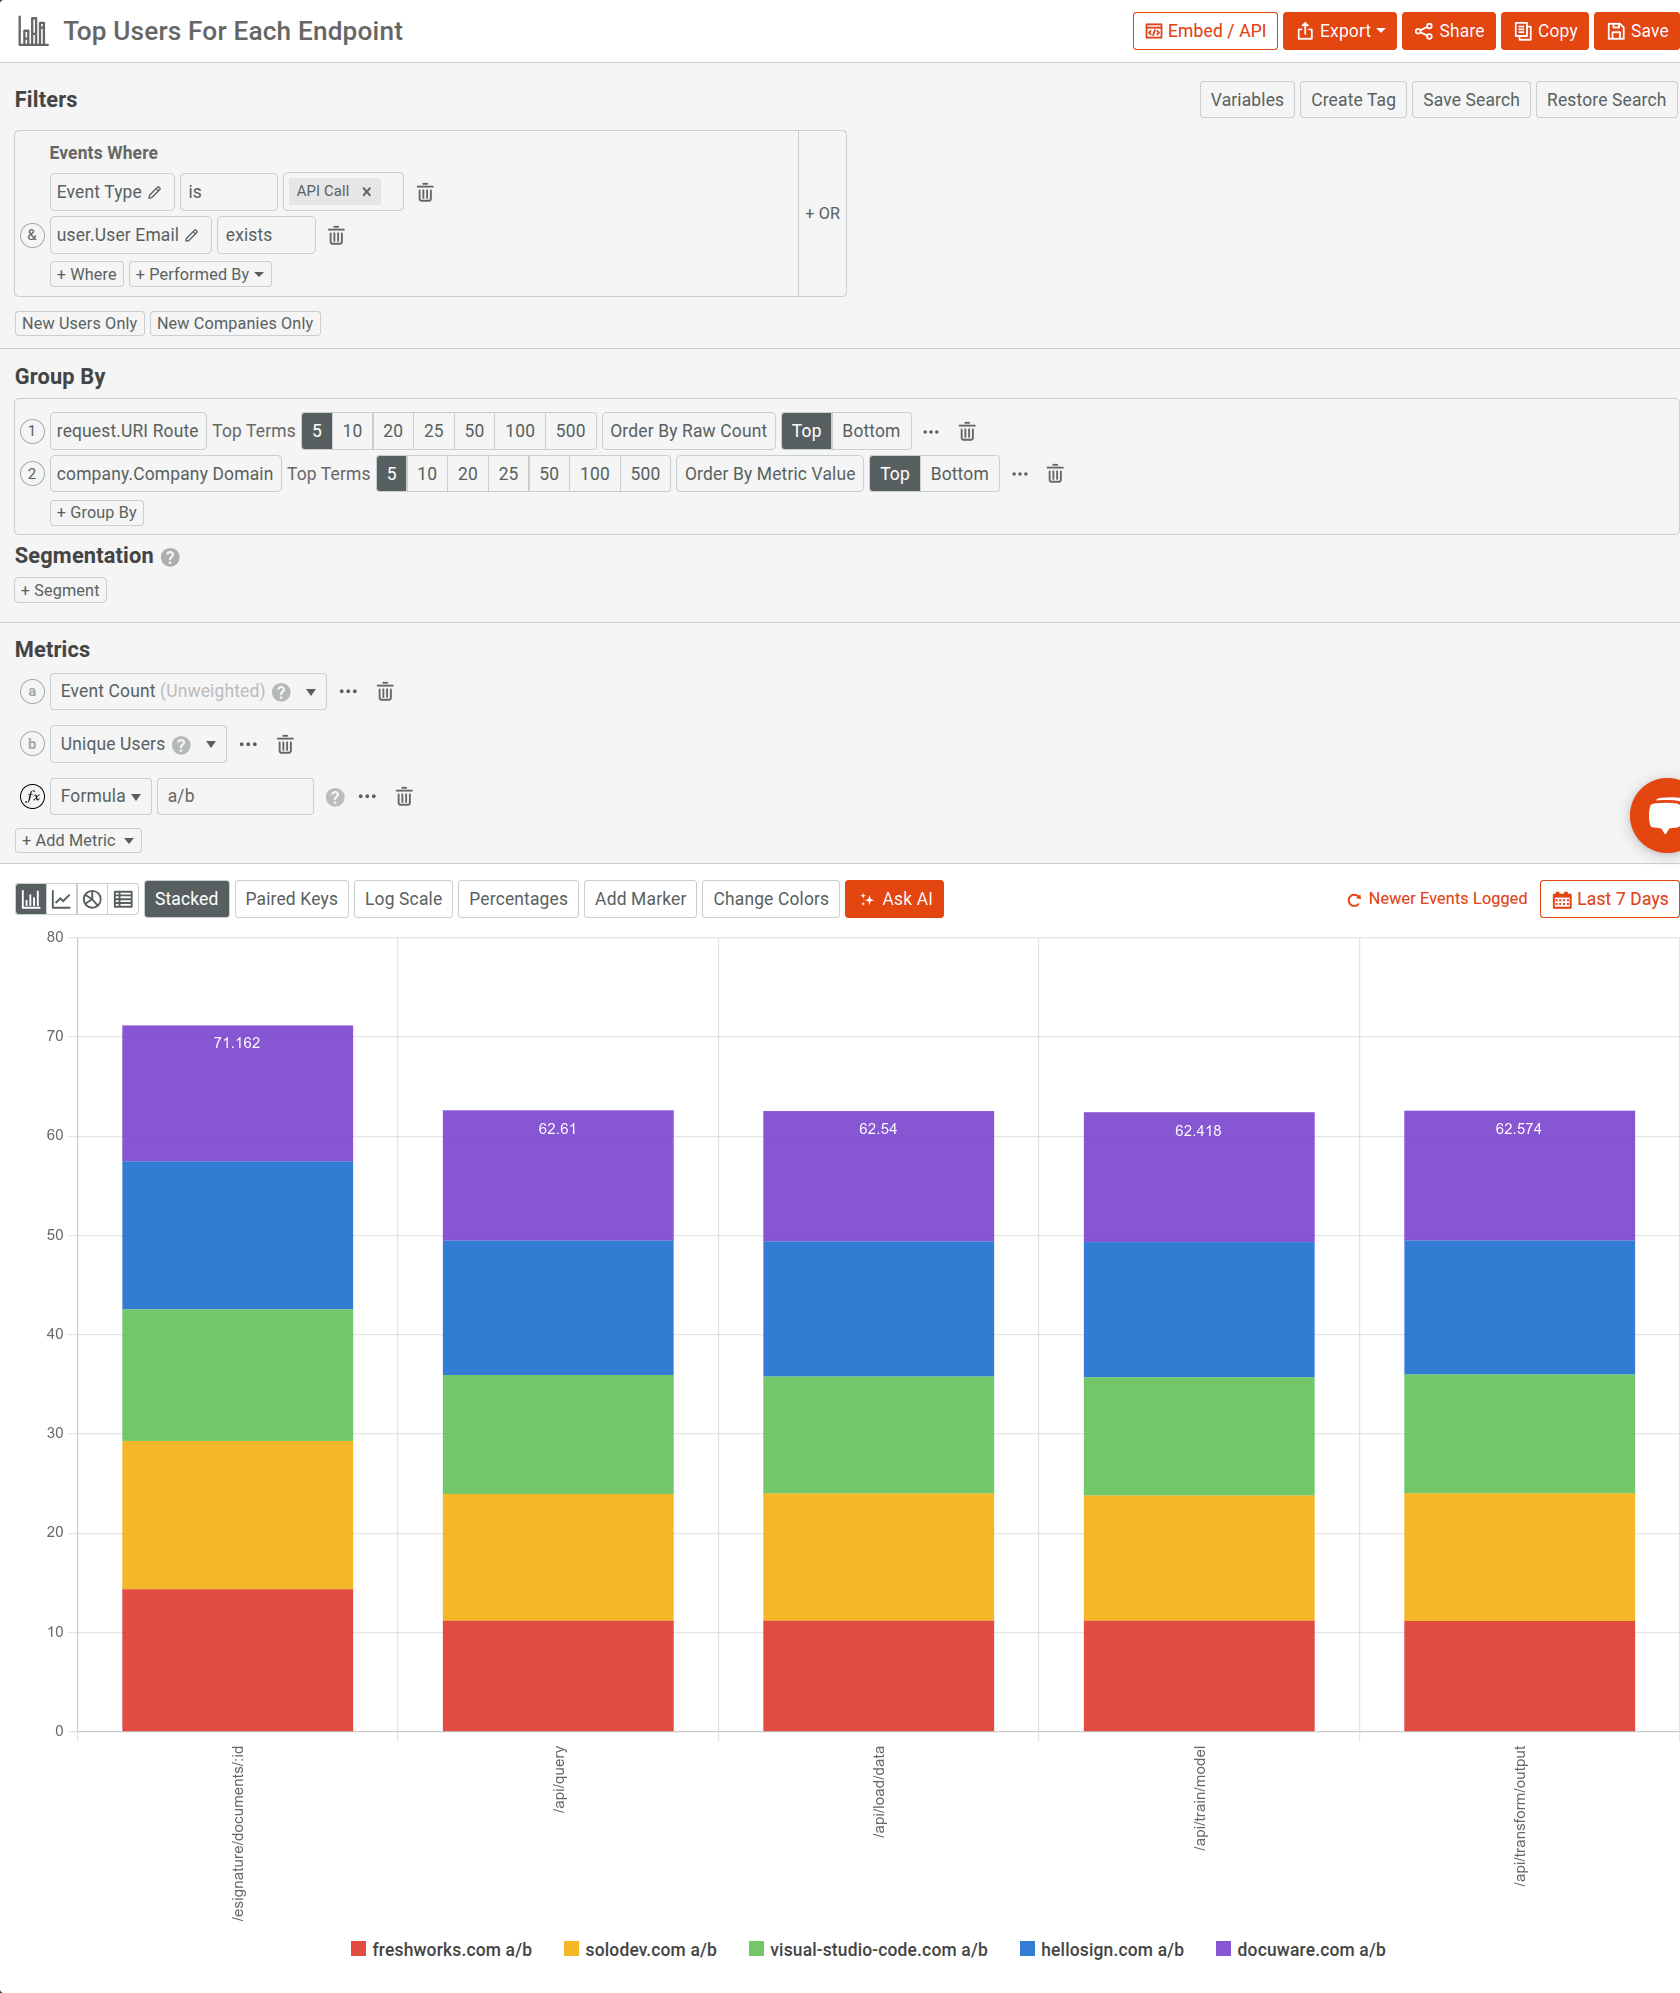
You can segment usage by different criteria like endpoint, SDK, or customer tier to understand which features drive sustained engagement, and which ones go underused.
For example, here a Segmentation analysis illustrates top customers for existing endpoints:
To prioritize what to build next and where to invest team effort, Moesif can help with API adoption analysis, through its usage segmentation and cohorts. You can confidently answer queries like these:
- Which customer tiers are adopting our new features the fastest?
- Are enterprise accounts activating key features, or are they stalled in early integration steps?
- How does adoption vary across SDKs, environments, or regions?
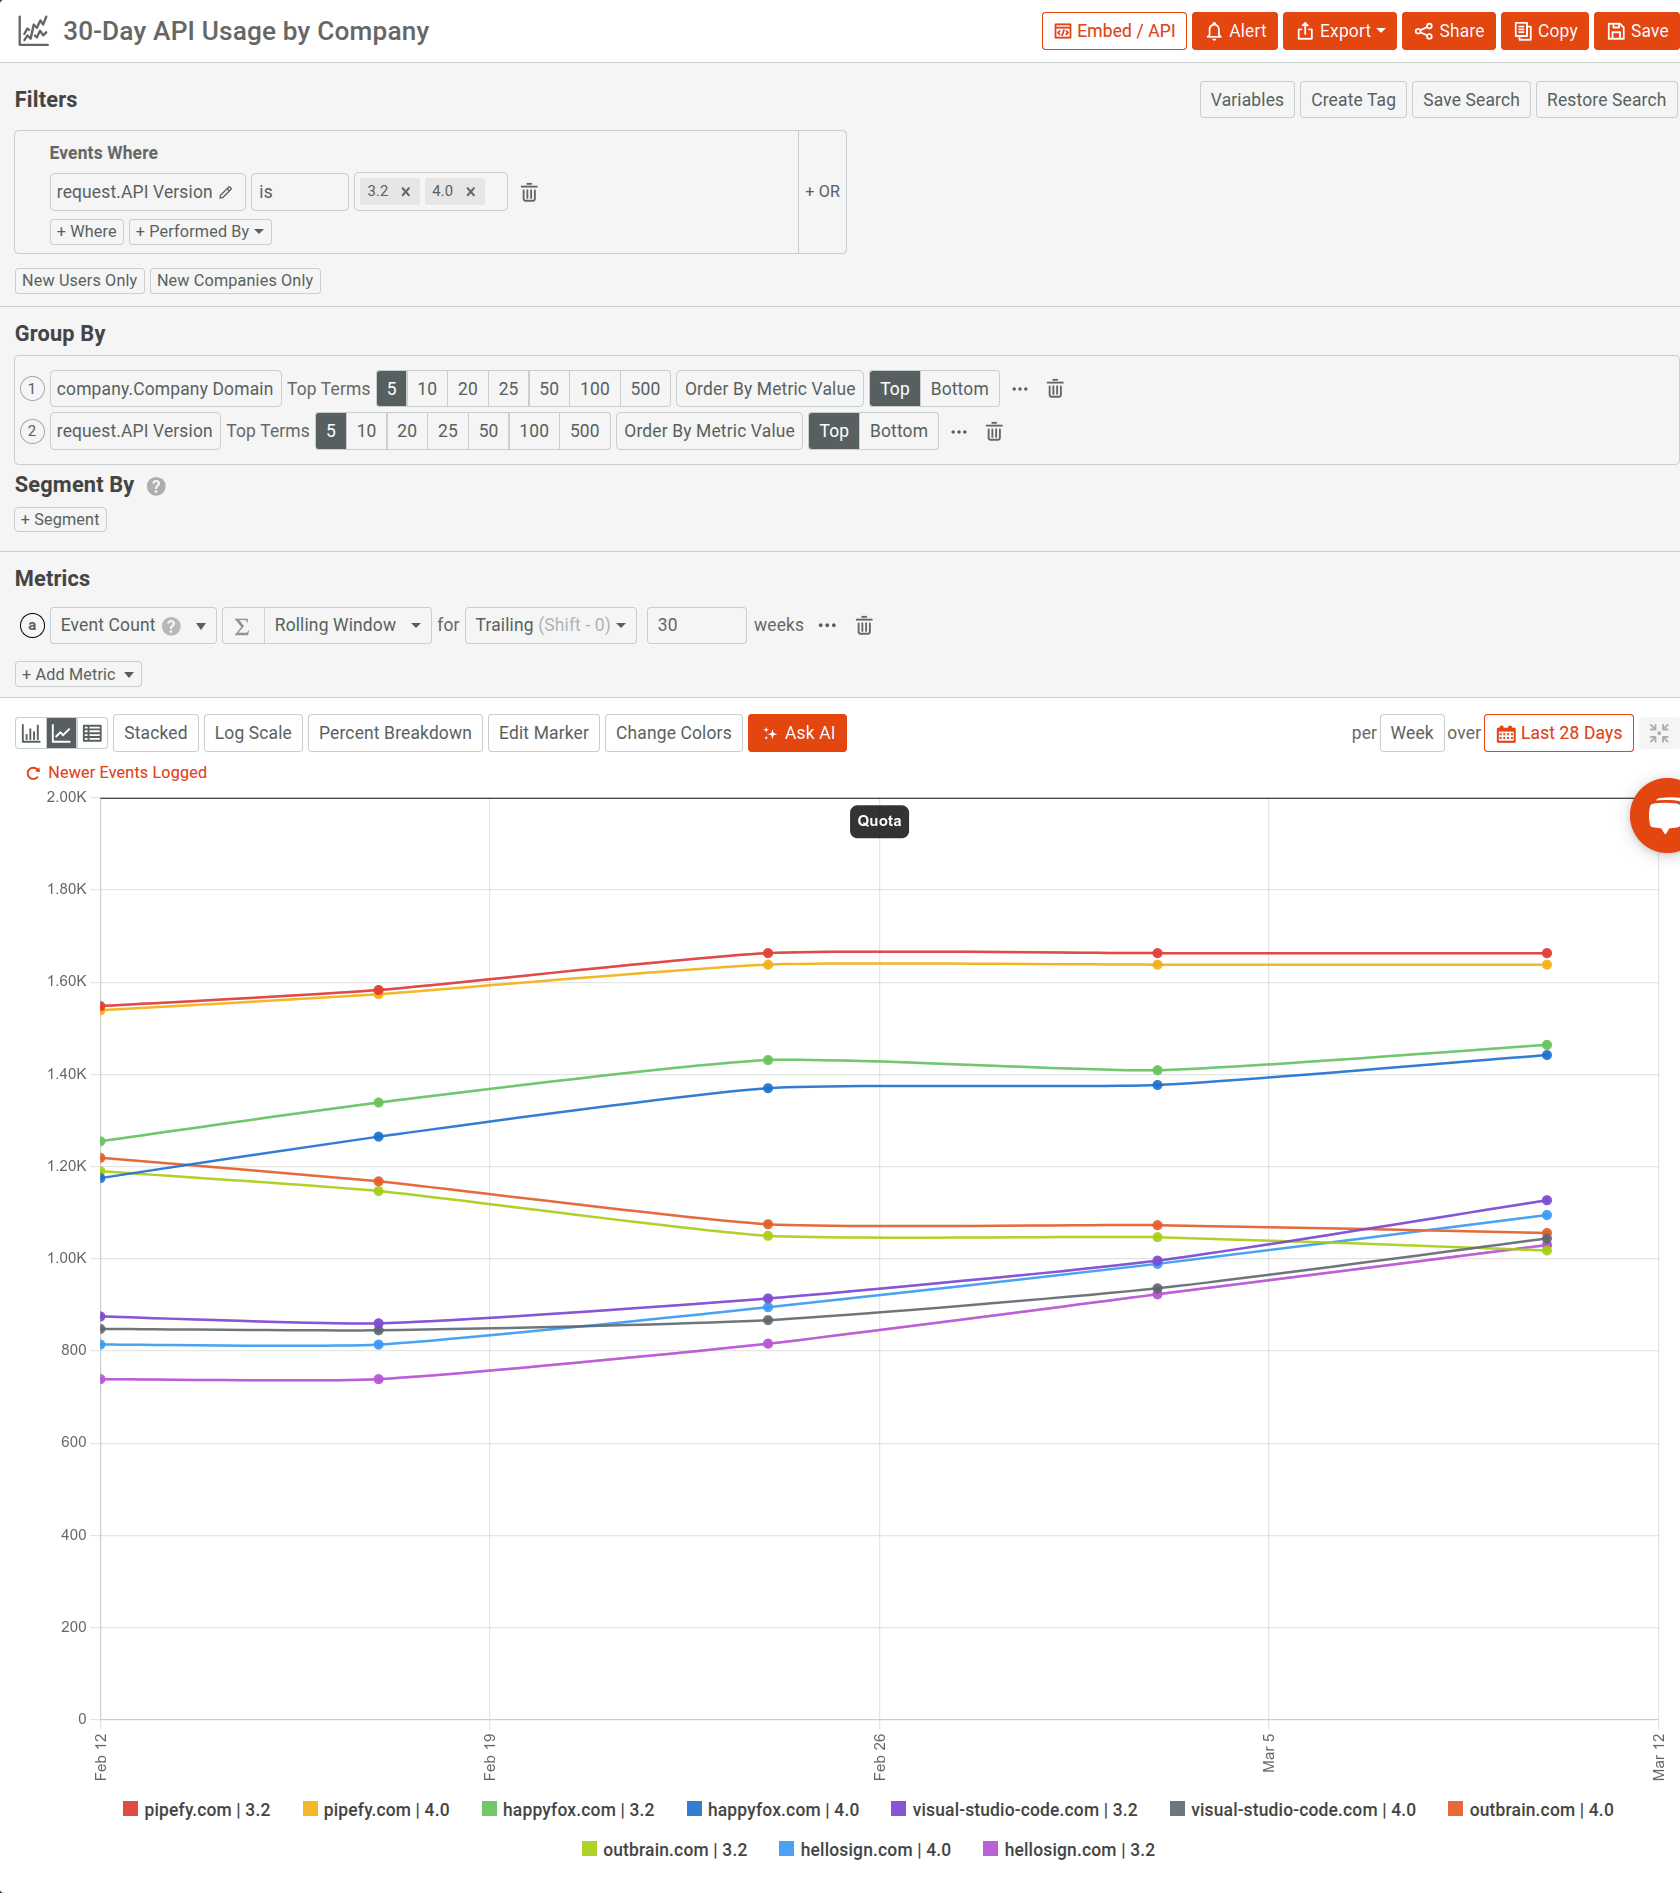
Consider you’ve released a new version of your API. You want to compare its uptake against the prior one across your existing customers. Using a monthly time window, you can segment API call volume by customer domain and version identifier. You can perform a rolling aggregation (rolling average or sum) to visualize adoption trends over time—highlighting how fast customers are migrating, and whether specific accounts or cohorts are lagging behind.
The following time series example shows such a use case:
AI Explain: Fast Insights Into Complex API Behavior
Moesif has built AI-powered features into its analytics and observability suite to enhance your experience.
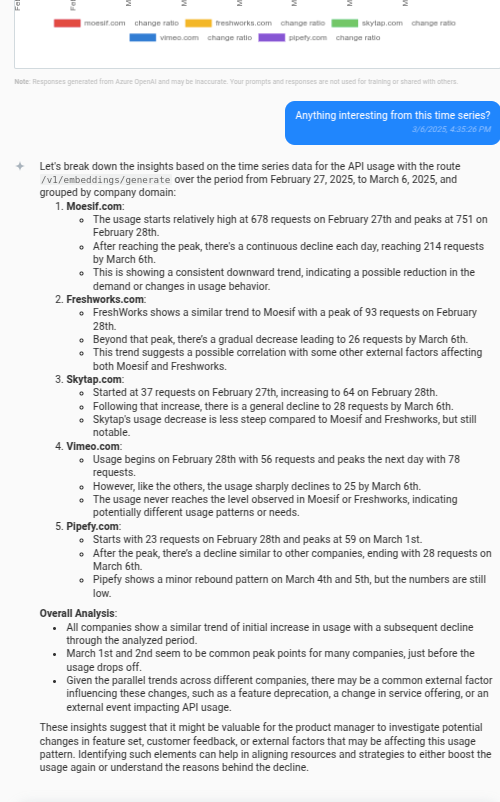
AI Explain provides an interactive, natural language-based conversational interface to empower non-technical shareholders with analytics insights. It works across API analytics, customer analytics, and alerting.
AI Explain surfaces key observations directly from your API traffic in one click, according to the analysis configuration you’ve defined in a workspace. For example, consider analyzing the growth of an embeddings API in Gloo Gateway:
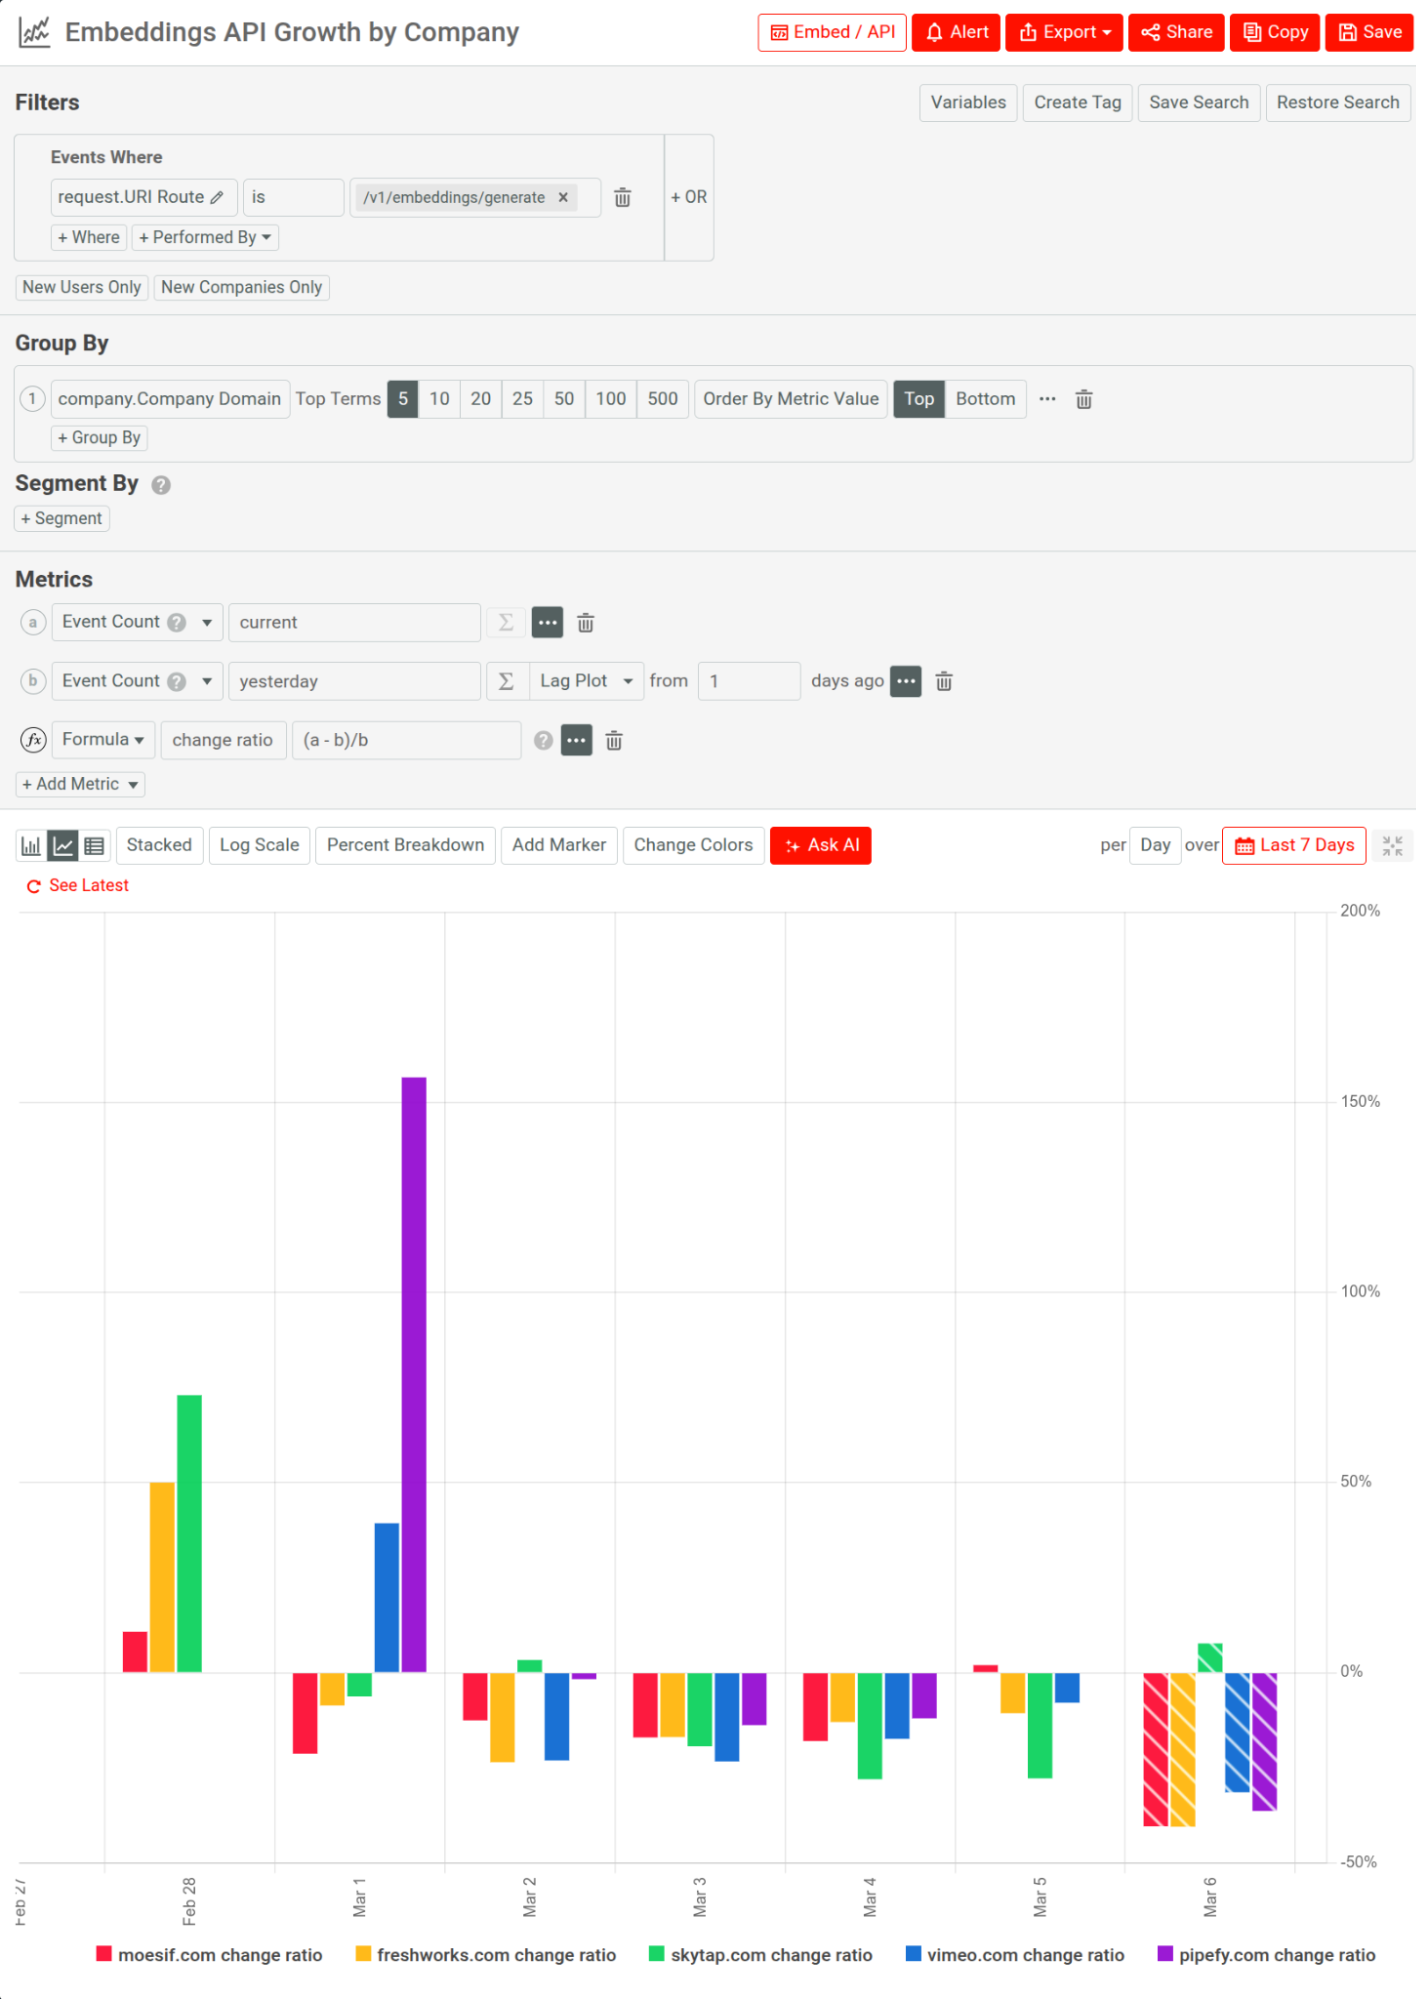
Select Ask AI to start asking questions about the analysis:
Moesif’s investment in AI features is grounded on making API analytics more accessible, explainable, and actionable across teams. To avoid every stakeholder needing to configure and build dashboards from scratch, these features lower the barrier to insight. Teams have at their disposal fast, natural ways to interrogate traffic patterns, detect anomalies, and explore customer behavior.
For engineering leaders, this means shorter incident investigation cycles, even in high-volume Gloo environments. Product and platform owners have quicker answers to strategic questions.
Conclusion
Modern API programs’ success hinges on two things: control and clarity. And successful APIs, in addition to being stable, are also adopted, retained, and evolved thoughtfully. Gloo Gateway delivers the control and makes sure the delivery path remains strong. And Moesif makes sure the feedback loop exists and provides clarity all around.
This article has tried to demonstrate how those layers complement each other for a shared visibility across engineering and product—empowering faster interaction, better onboarding, and more strategic planning. When you account for both performance and context, your teams will move faster with fewer blind spots.


