Top API Metrics to Track for Product-Led Growth
Product-led growth hinges on delivering exceptional user experiences. If you build a great product with valuable features, users are bound to come and stick to your services. But companies often neglect the role of APIs. Modern software relies heavily on APIs for integrations, automation, and data exchange. Not to mention, for API or API-first products, APIs drive the most crucial pieces of success goals. A poorly performing API creates friction, frustrates users, and impedes growth.
For successful product-led growth, companies must prioritize both excellent user experiences and robust API performance. And to achieve that, you have to understand the API metrics that matter. In this article, we explore these essential metrics and discuss how you can optimize your API and fuel product-led growth.
Table of Contents
- The Role of APIs in Product-Led Growth
- Key API Metrics for Product-Led Growth
- Tools to Monitor API Metrics for Product-led Growth
- How to Align Metrics with Business Goals
- Conclusion

The Role of APIs in Product-Led Growth
Product-led growth relies on the product itself to drive user acquisition, engagement, and retention. Instead of heavy sales efforts, the product’s value propels adoption. Every team member and their respective team efforts center around the product itself. And APIs lay the foundation of these product-led growth strategies.
APIs directly impact user experiences by facilitating smooth interactions between different applications and services. For example, consider ordering food online. A restaurant’s API connects their ordering system with delivery services like DoorDash for real-time updates and a seamless experience for the customer. APIs in SaaS platforms like Stripe allow businesses to integrate payment capabilities without building infrastructure from scratch. Businesses can reduce time-to-market and increase customer satisfaction, both being significant contributors to product-led growth.
APIs help promote self-service adoption by enabling scalable, user-driven functionality. Developers can integrate APIs directly into their applications without extensive support. This in turn also drives customer acquisition and organic adoption. For example, using Twilio’s well-documented APIs, users can independently build messaging capabilities in their apps.
APIs also help you make data-driven decisions by collecting and exposing usage insights. API analytics track performance, adoption, and engagement metrics in real time. For example, Moesif’s API monitoring tools give you an end-to-end comprehensive view to ensure that APIs meet user needs while helping you identify opportunities for optimization. This data helps teams align API performance with business objectives as the product and market evolves.
Another core driver of product-led growth is API monetization. APIs open new revenue streams by enabling companies to offer functionality as a service. For example, Shopify’s API ecosystem allows third-party developers to create and sell integrations, expanding the platform’s reach while generating revenue. APIs shift value creation from the company to its ecosystem for a more amplified growth potential. It almost feels like the product and its customers help each other grow.
If you can execute your API strategy well, it aligns directly with customer needs. APIs make products extensible, customizable, and interoperable, creating value across diverse use cases. Businesses can confidently take more calculated risks because they possess the means to do so and penetrate more into the market with their products or ideas. By meeting customer demands through APIs, businesses build loyalty, attract new users, and exceed their expectations. And these ultimately contribute to strong customer retention and growth.
Key API Metrics for Product-Led Growth
Tracking the right API metrics aligns your product’s technical performance with user engagement and business outcomes. Let’s discuss the essential metrics across adoption, performance, business impact, and developer experience.
User Engagement Metrics
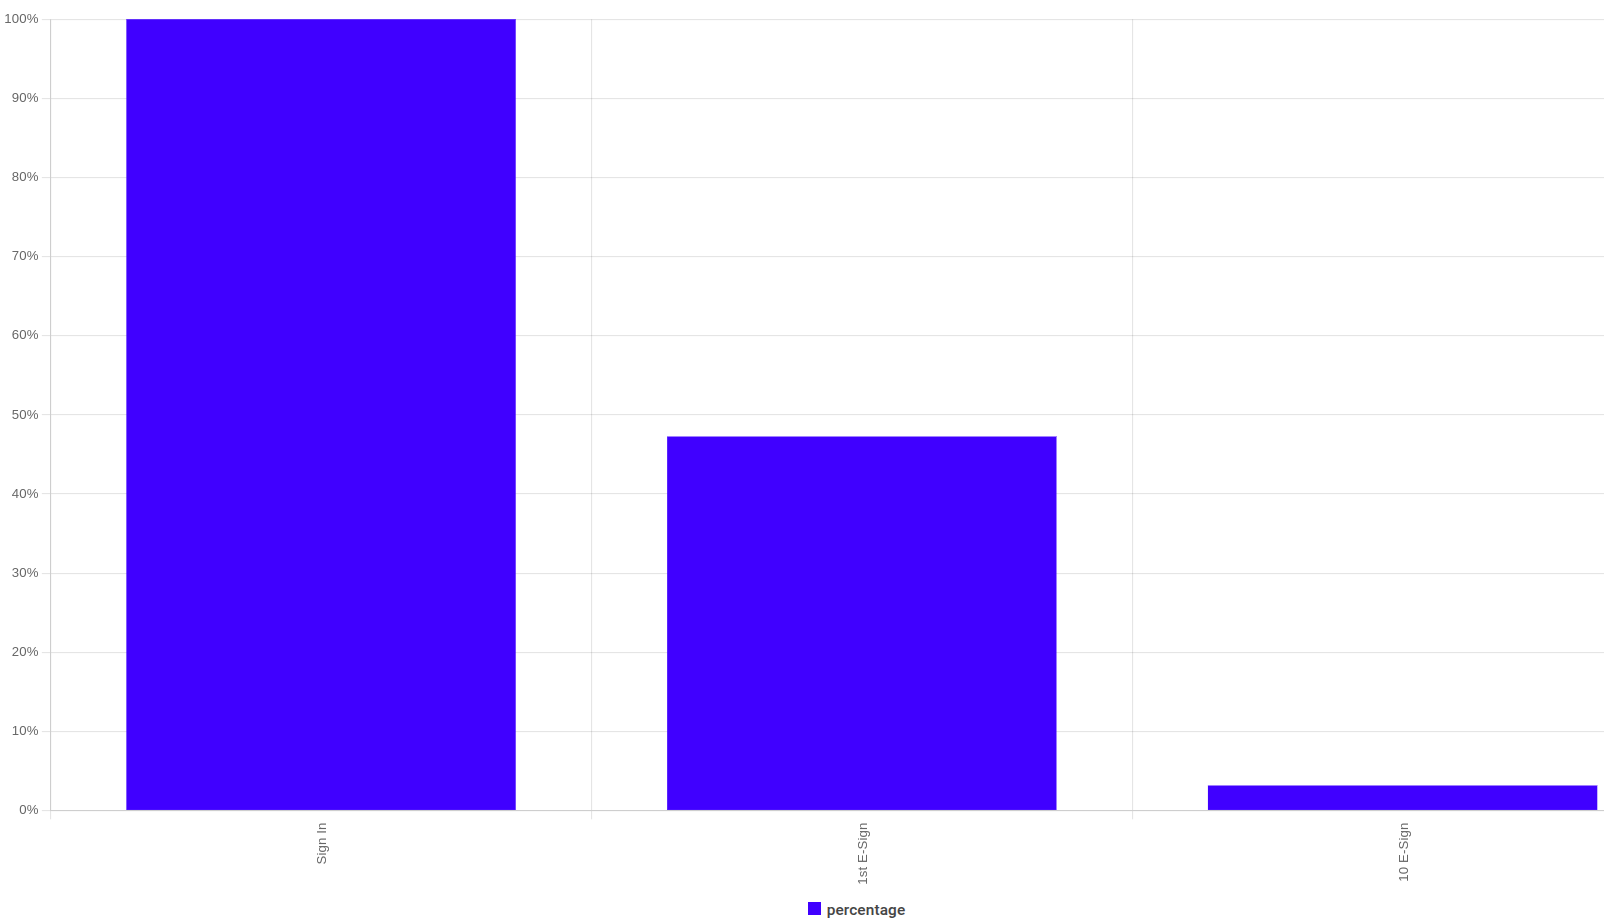
Adoption Rate
Adoption rate measures how quickly users start using your API after onboarding. Track the number of new users making their first successful API call within a defined period. A high adoption rate means you have a solid onboarding process. If you craft intuitive documentation and accessible SDKs, you can build onboarding processes that users find delightful and get fast value out of. For example, Twilio Code Exchange has ready-to-use code samples that demonstrate hands-on what users can build and accomplish.
To improve adoption, identify drop-off points in the onboarding journey and address them through developer feedback or funnel analysis.
Active Users (DAU/MAU)
Active users metrics, like daily active users (DAU) and monthly active users (MAU), highlight ongoing engagement with your API. DAU measures daily interactions, while MAU tracks monthly trends, helping you detect growth or churn patterns and leading, lagging indicators.
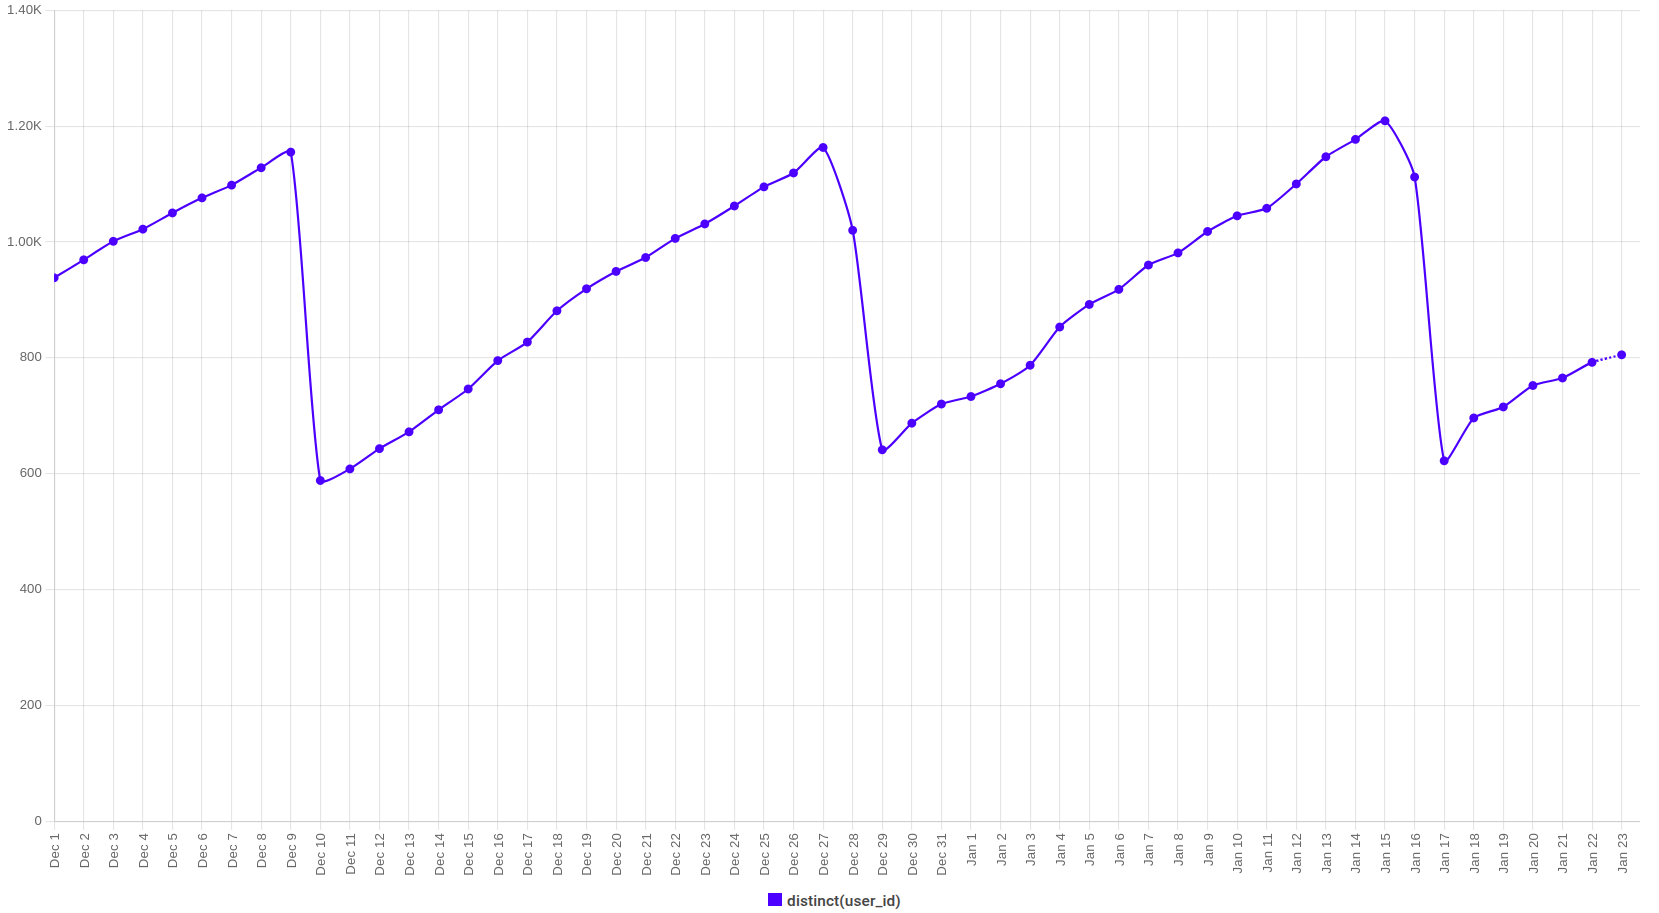
For example, if MAU rises but DAU stagnates, your API might lack stickiness or daily relevance. On the other hand, if you observe DAUs going up, but your MAUs going down, it means a large amount of churn—you have an increasing number of new users using the app everyday, but they aren’t coming back.
Analyze these trends and correlate them with product updates, marketing efforts, or seasonal shifts to make informed improvements.
Retention Rate
Retention rate measures the percentage of users who continue using your API after their initial adoption. High retention indicates ongoing value and a positive developer experience. Retention also correlates with API reliability and performance. Being able to drill down into retention data helps you evaluate the long-term appeal of your products.
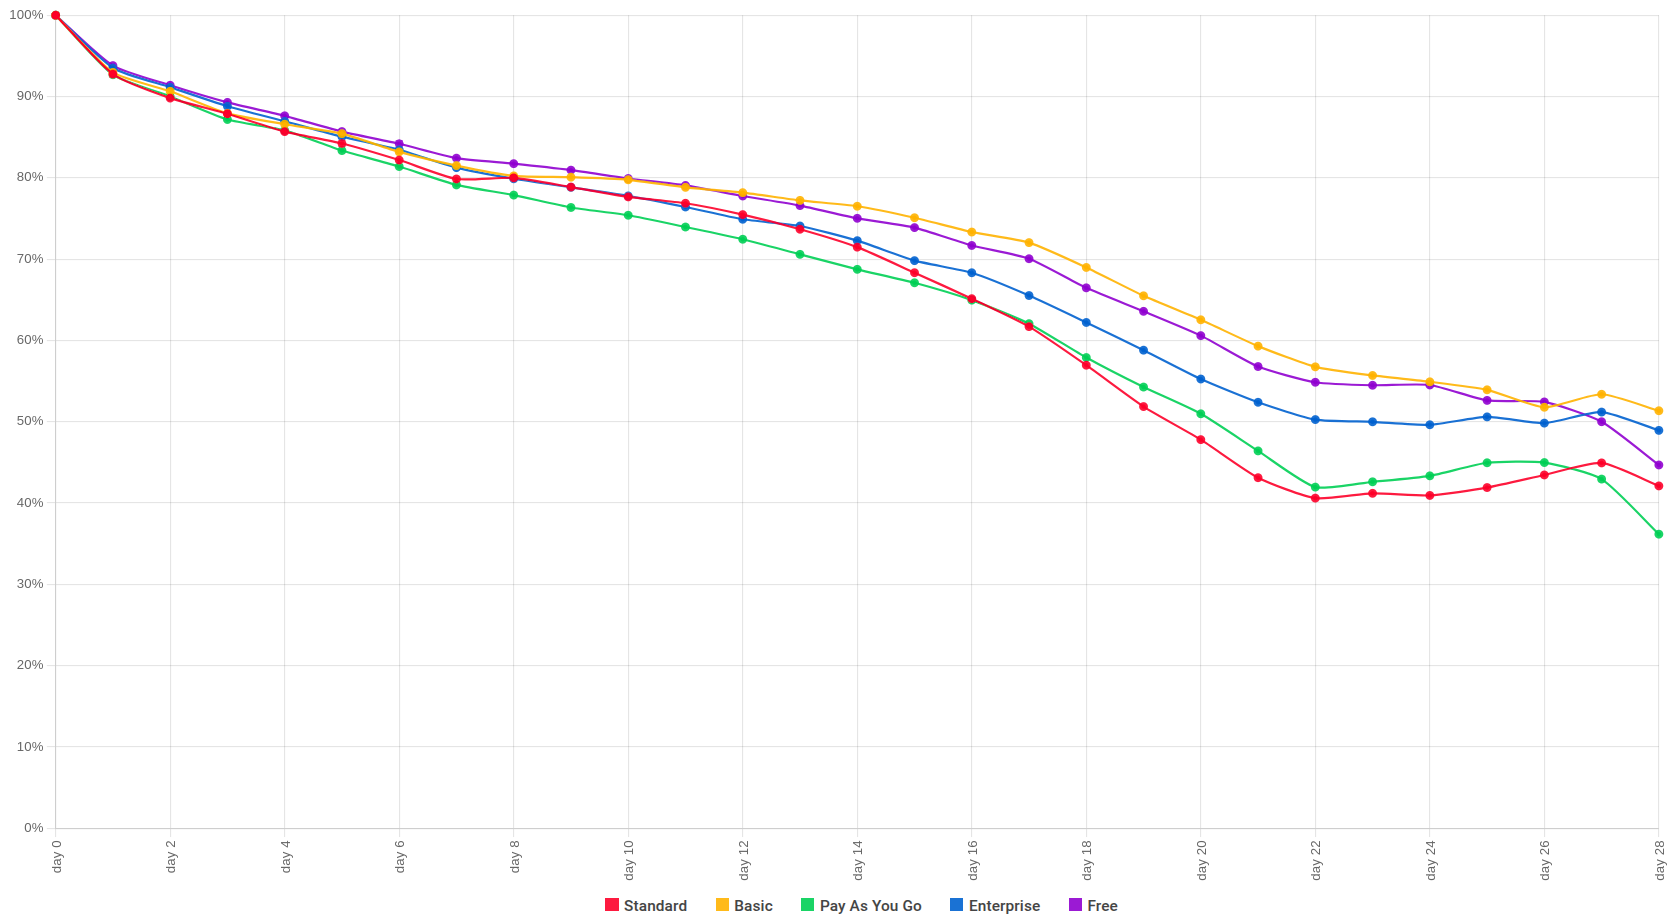
You can segment retention data by user cohorts to identify variations, for example, free versus premium users. Monitoring retention trends like this helps you identify what segments find the most value and when drop-offs occur.
API Performance Metrics
Latency
Latency defines how responsive your API feels to users. Measure average response times and percentile metrics like P90 and P99 to understand performance across different use cases. For example, a payment API with a P99 latency above 500ms risks losing transactions. High latency often correlates with decreased user satisfaction, especially for real-time applications. By comparing latency across endpoints or regions, you can identify areas where performance optimizations can enhance user interactions.
Error Rate
The error rate tracks the percentage of failed requests and reveals areas users face struggles. You can break errors into client-side (4xx) and server-side (5xx) to identify the root source of the problem—user actions or system problems. For example, recurring 403 Forbidden errors may point to access control misconfigurations, while frequent 500 Internal Server Errors often signal backend capacity issues.
Uptime
Uptime measures the availability of your API and reflects how consistently users can access your service, usually expressing it as a percentage. For mission-critical APIs, even a few minutes of downtime can damage user trust and cause financial losses. By monitoring your products and services’ uptime, you can understand their overall health, recurring downtime during peak usage, scheduled maintenance impacts, and so on. It helps you make sure your service meets reliability expectations.
Business Impact Metrics
Revenue Attribution
This metric ties API usage directly to revenue and thus illustrates how the API drives financial outcomes. For example, SaaS platforms like Stripe calculate revenue based on API call volumes tied to payment transactions.
Revenue attribution provides clarity on which user segments or API features deliver the highest business value. If you track which endpoints or integrations contribute the most revenue, you can prioritize features and refine your existing pricing models.
Expansion Revenue
Expansion revenue measures growth opportunities from existing users by analyzing increases in API usage over time. This metric identifies high-growth customers who may be ready for upsell opportunities. By tracking expansion revenue by usage tier or feature adoption, you can find out the exact parts of your API ecosystem that drive additional revenue.
Cost Efficiency
Cost efficiency measures the expense associated with each API call, including infrastructure, development, and support costs. High costs per call often indicate inefficiencies, such as redundant API calls or inefficient database queries. By tracking this metric, you can plan out and execute optimization strategies for resource utilization and profitability. You can uncover areas where scaling issues may arise, or operational improvements can increase margins.
Developer Experience Metrics
Time to First API Call (TTFC)
TTFC or TTFHW (Time to First Hello World) measures how quickly developers can make their first successful API call. A shorter TTFC indicates smooth onboarding experiences, while a longer TTFC may point to barriers in integration. By tracking TTFC over time, you can thoroughly understand whether changes in onboarding resources, such as documentation or SDKs, impact developer engagement.
Support Ticket Volume
Support ticket volume tracks how often users face issues with your API and require assistance. High ticket volume often points to unclear documentation, usability problems, or bugs. Regularly analyze ticket trends to identify recurring problems and take actionable steps so they don’t become a major hurdle. For example, if many tickets relate to authentication, consider improving your guides or error messaging.
SDK/Documentation Quality Score
This metric measures how effectively your documentation and SDKs meet developer needs based on user feedback or engagement. For example, a low documentation quality score might correlate with higher support ticket volume.Monitoring this metric helps you assess the impact of updates and ensures your resources stay aligned with user expectations.
Both versions emphasize Moesif’s strengths and position it as the ideal tool for tracking API metrics. However, there are notable differences in focus, depth, and framing. Here’s a thorough evaluation and suggestions for a refined version that combines the strengths of both while improving readability, clarity, and alignment with product-led growth principles:
Tools to Monitor API Metrics for Product-led Growth
To effectively track API metrics that compliments your product-led growth strategies, you need tools that can deliver actionable insights into user behavior and product performance. Let’s briefly explore some leading options.
Moesif
Moesif provides advanced API analytics that go beyond basic monitoring. It captures detailed user interaction data, including endpoint usage, common errors, and trends over time. These insights help uncover friction points in the user journey and optimize the API experience. For example, by analyzing error patterns, you can identify recurring issues affecting specific user groups and address them proactively.
One of Moesif’s key strengths comes from its powerful segmentation and grouping utilities. Businesses can segment users by behavior, demographics, subscription tier, or geographic location. This segmentation provides a more granular understanding of how different user groups interact with your API. For example, identifying power users allows you to tailor features and drive expansion revenue. You can create custom cohorts and set up automated alerts that can notify you about critical events in real time. These features empower you with data-driven decisions that align with product-led growth objectives.
Moesif also tracks critical metrics like Time to First Call (TTFC), adoption rate, and retention rate through its comprehensive user and company analytics suite. You can get an end-to-end view into product use, adoption, and user behavior.
Furthermore, Moesif provides intuitive visualization dashboards that you can customize, extend, and further build up on, including raw analytics data to build custom workflows yourself. Moesif has also built AI-powered conversational interfaces for metrics. This allows you to immediately get actionable insights into metrics data, irrespective of your skill level in navigating or comprehending analytics data. This highly resonates with one of the core philosophies of product-led growth—your teams participate in decision making and growth efforts together.
Moesif has a rich ecosystem of growing integrations with various platforms and tools, including CRMs like HubSpot and Salesforce. You can easily add Moesif to your existing technology stack with minimal friction.
Moesif also has robust monetization features that natively works with top billing providers like Stripe and Recurly. You can even implement your own custom billing through webhooks where Moesif accurately tracks and meters usage. The monetization features build on top of the existing analytics tools to drive growth in a coherent and structured manner.
Postman
Postman is a popular platform for creating, testing, and documenting APIs. Postman’s monitoring features help teams validate API performance and uptime to make sure production APIs function as expected. Postman offers excellent utility for development teams during the API build and test phases.
While Postman provides basic monitoring, it is not designed for tracking long-term user behavior or business impact metrics. Its focus on testing and development limits its ability to provide actionable insights for product-led growth.
Datadog
Datadog is a versatile monitoring tool designed for tracking application performance, infrastructure health, and APIs. You get visibility into API uptime, latency, and error rates, helping teams maintain reliable services. Datadog’s intuitive dashboards allow teams to monitor performance metrics across distributed systems, making it a strong choice for organizations managing complex environments.
However, Datadog lacks advanced user behavior analytics and segmentation capabilities. While it identifies technical performance issues, it does not provide the granular insights into user adoption, retention, or monetization that product-led growth strategies demand. For businesses prioritizing API-driven growth, Datadog serves as a complementary tool but does not replace Moesif’s targeted analytics.
How to Align Metrics with Business Goals
Aligning API metrics with business goals provides measurable outcomes that directly contribute to successful product-led growth for organizations. To properly align metrics with bigger-picture objectives, you need to take a structured approach to identifying priorities, setting benchmarks, and making data-driven decisions. Here are some general guidelines that can help you.
Start with Clear Business Objectives
Begin by defining your organization’s primary goals, whether it’s driving revenue, improving customer retention, or scaling operations. For example, if you prioritize revenue growth, focus on metrics like revenue attribution and expansion revenue. These metrics reveal the endpoints or user groups that generate the highest financial value and thereby help you prioritize investments.
Map Metrics to User Journeys
Connect metrics like adoption rate, retention rate, and TTFC to specific stages of the user journey. For example, TTFC reflects the effectiveness of your onboarding, while retention rate shows long-term satisfaction. Mapping these metrics helps teams identify gaps in the user experience and align improvements with business objectives.
Set Benchmarks and KPI
Establish realistic benchmarks for each metric to measure progress. For example, you can aim for a retention rate of 85% or reduce TTFC by 20% within a quarter. Having such KPIs provide clear targets for teams to work toward and ensure alignment across departments.
Leverage Tools for Real-Time Insights
Use platforms like Moesif to track metrics and gain actionable insights in real time. Moesif’s segmentation and grouping capabilities allow you to analyze user behavior by region, subscription tier, engagement level or source, and other criteria. These insights help you plan and execute targeted strategies, such as improving adoption rates in underperforming regions or tailoring pricing plans for high-value customers.
Incorporate Feedback Loops
Regularly review metrics with cross-functional teams. For example, if error rates increase, involve engineering teams to diagnose and resolve issues. Efficient feedback loops ensure that metrics remain relevant and actionable.
Communicate Metrics Across Teams
Ensure that all teams—from product managers to executives—understand the metrics relevant to their roles. Use dashboards and reports to provide a unified view of progress toward business goals. Through a transparent and collaborative mindset, you can keep everyone focused on shared objectives.
Adapt to Market Trends
Monitor how your metrics compare to industry standards and competitors. For example, a low adoption rate may signal that your onboarding process lags behind market leaders. Use these insights to refine your strategy and maintain a competitive edge.
Conclusion
Product-led growth has shifted how businesses think about their products and scale. The product itself leads the multifaceted efforts of a company towards success where all stakeholders take part, fostering a collaborative mindset that focuses on delightful user experiences. But not all product-led companies succeed. For API-first or API products, it’s very important that you leverage the relevant metrics to guide your decision making and strategies.
If you want to see for yourself how Moesif can help you with product-led growth, sign up today for a free trial, no credit cards required.


Related Articles

API Strategy
Leveraging AI For a Better API Strategy
Learn how to leverage AI to build and fortify your API strategy. Improve design, governance, documentation, and align APIs with business outcomes.
API Strategy
The 5 Best Mixpanel Alternatives of 2025
Learn about the best Mixpanel alternatives to determine the right analytics solution for your use case.

API Development
How to Leverage Moesif Effectively for API Observability
Effectively leverage Moesif for API observability through best practices for integration, event enrichment, custom actions, and engineering workflow integrat...
API Strategy
How to Build an Internal Chargeback Model for Your API and AI Usage Using Moesif
Use Moesif to implement internal chargebacks and enable precise API and AI cost attribution for better transparency and resource optimization.
