Analyzing OpenTelemetry Logs in Moesif for Operational and Business Insights
As your application grows, the volume of telemetry data expands with it. Every additional service, customer, and feature generates more log entries. It becomes harder to quickly isolate the events that actually matter. Without the right tools, finding a single root cause can feel like searching for a needle in an ever-growing haystack.
You may have already been using log search tools to find and act on errors. However, those tools rarely connect that data back to your API traffic patterns or metrics. OpenTelemetry logs are standardized, but developers still need a way to slice, filter, and analyze them at high cardinality and high dimension without losing performance.
To overcome these challenges, we have added logs support in our OpenTelemetry integration. You can now send your OTel logs directly to Moesif. This allows you to correlate logs with traces, link them with API calls, and drill into the data with the same powerful analytics used for API metrics.

From Noise to Insight
You likely send logs to monitoring tools like Datadog. However, OTel logs also contain hidden business insights; you can leverage those insights to track product experience and usage metrics. Moesif’s powerful analytics can analyze OTel logs, assuming they contain structured JSON:
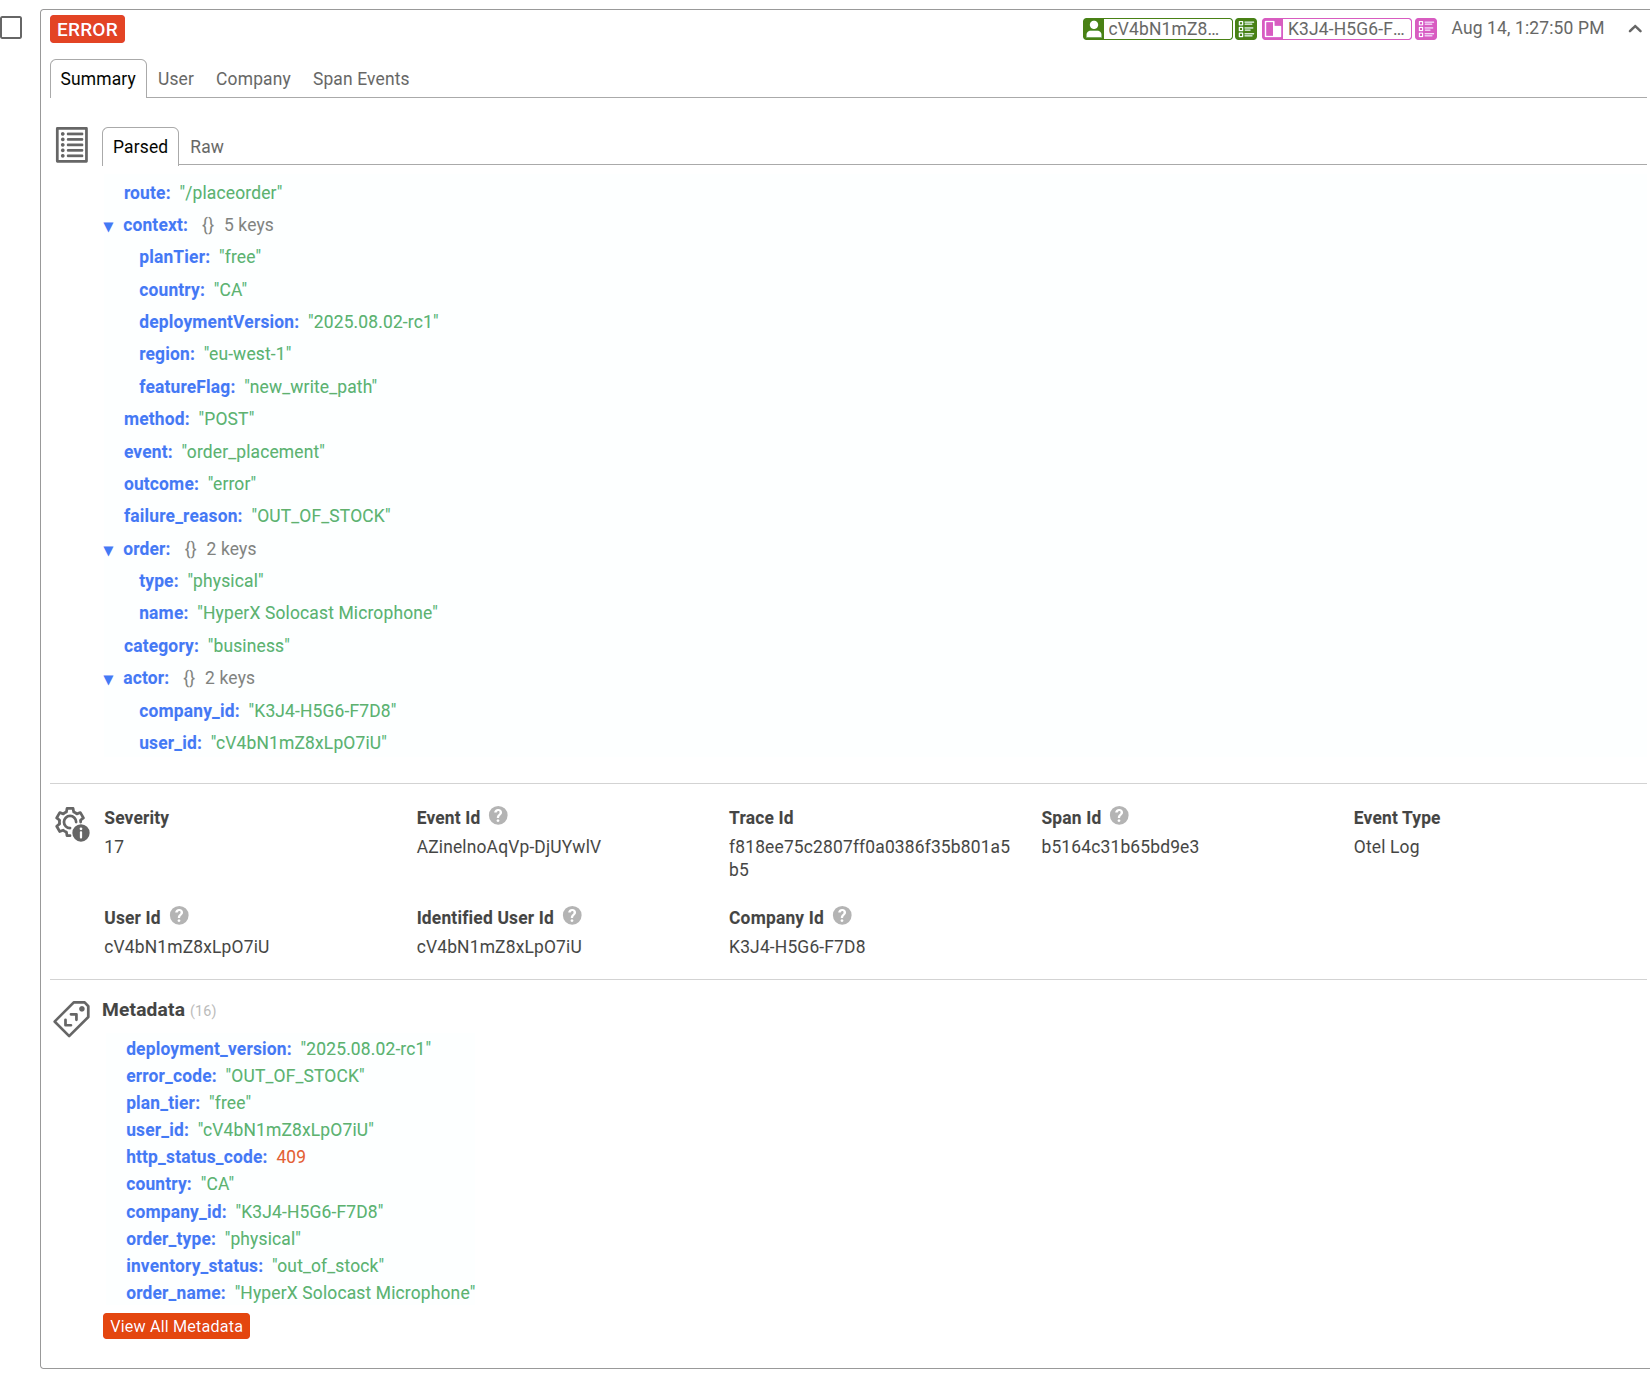
Logs tell you what happened, whereas API analytics tell you how often it happened and under what conditions. Moesif’s OTel logs support puts both in the same place for better operational analysis. Using Moesif’s API analysis types, you can now incorporate logs into your metrics filters and visualizations. You can instantly see trends, patterns, and hotspots, all within the context of your API activity.
What is New
- Natively ingest logs from any OpenTelemetry Collector or OpenTelemetry SDK-instrumented application.
- Analyze structured JSON containing business-specific information to drive critical decisions. Moesif automatically parses log data and makes them available for analytics.
- Cross-link logs with traces, API calls.
- Reduce data silos by reviewing both API usage metrics and logs in the same analytics views.
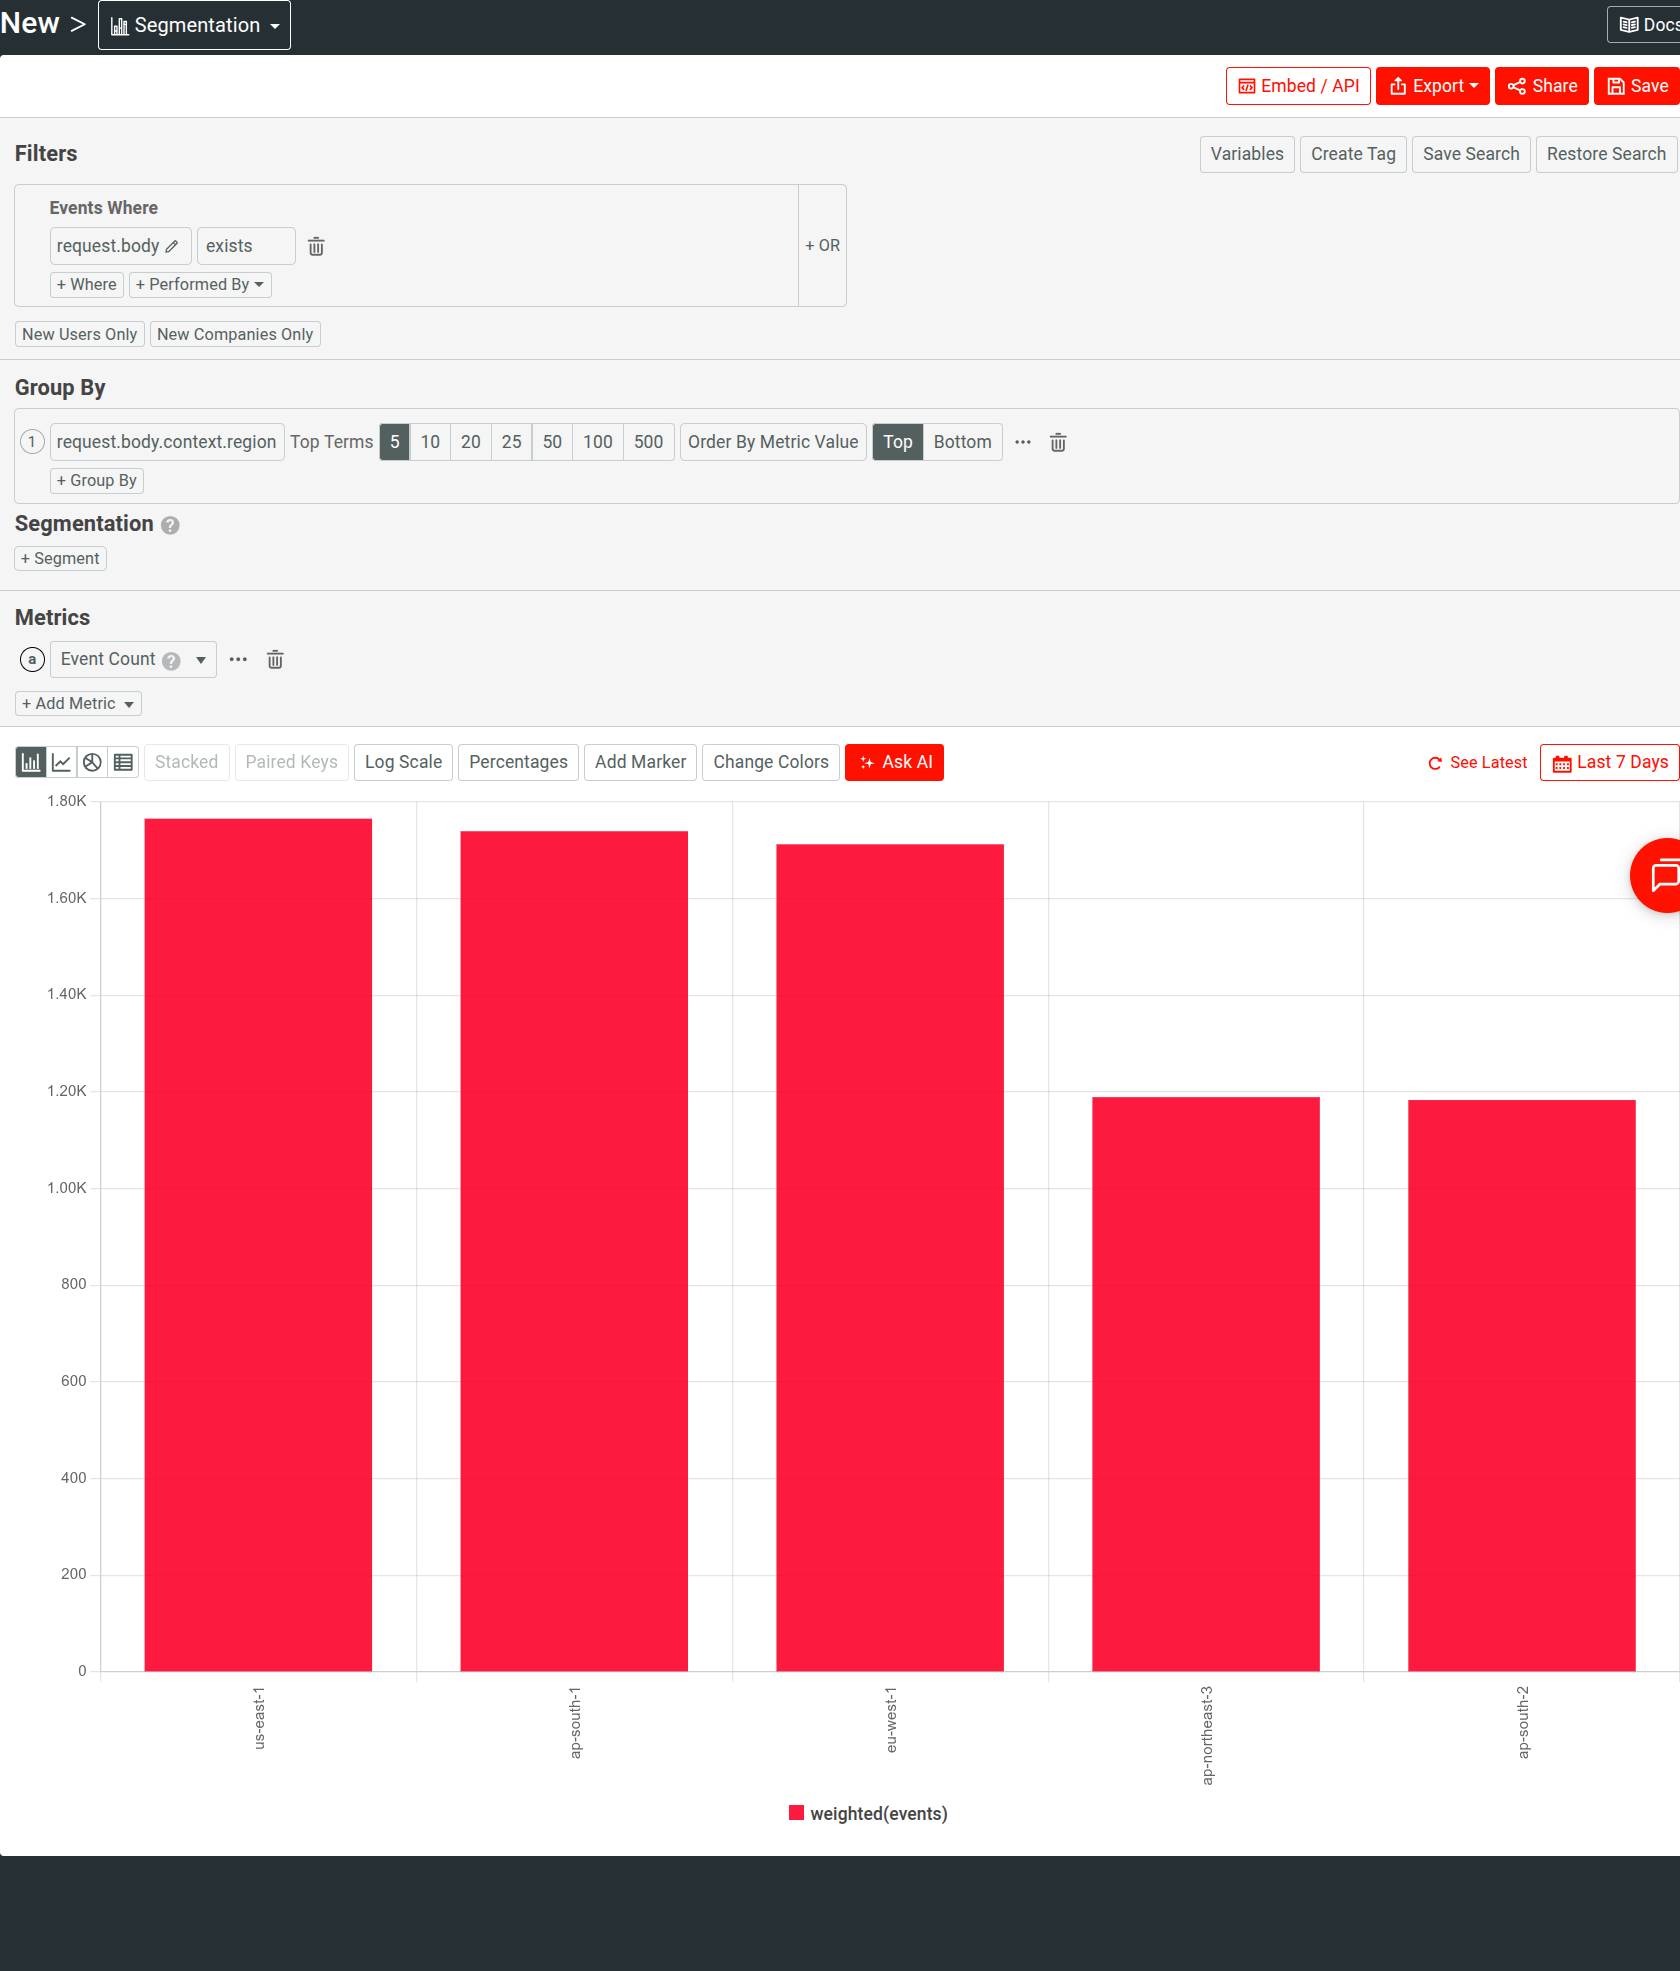
The following Segmentation chart uses log data to illustrate event count across deployment regions:
OpenTelemetry logs are available in filters for API analysis types only. They are not supported in customer analytics like funnels and retention.
How it Works
Simply configure your OpenTelemetry Exporter to send logs to Moesif over OTLP/HTTP:
exporters:
  otlphttp/logs:
    endpoint: https://api.moesif.net/v1/logs
    headers:
      X-Moesif-Application-Id: 'YOUR_MOESIF_APPLICATION_ID'
Make sure to include your Moesif Application ID in the request headers as X-Moesif-Application-Id to authenticate requests.
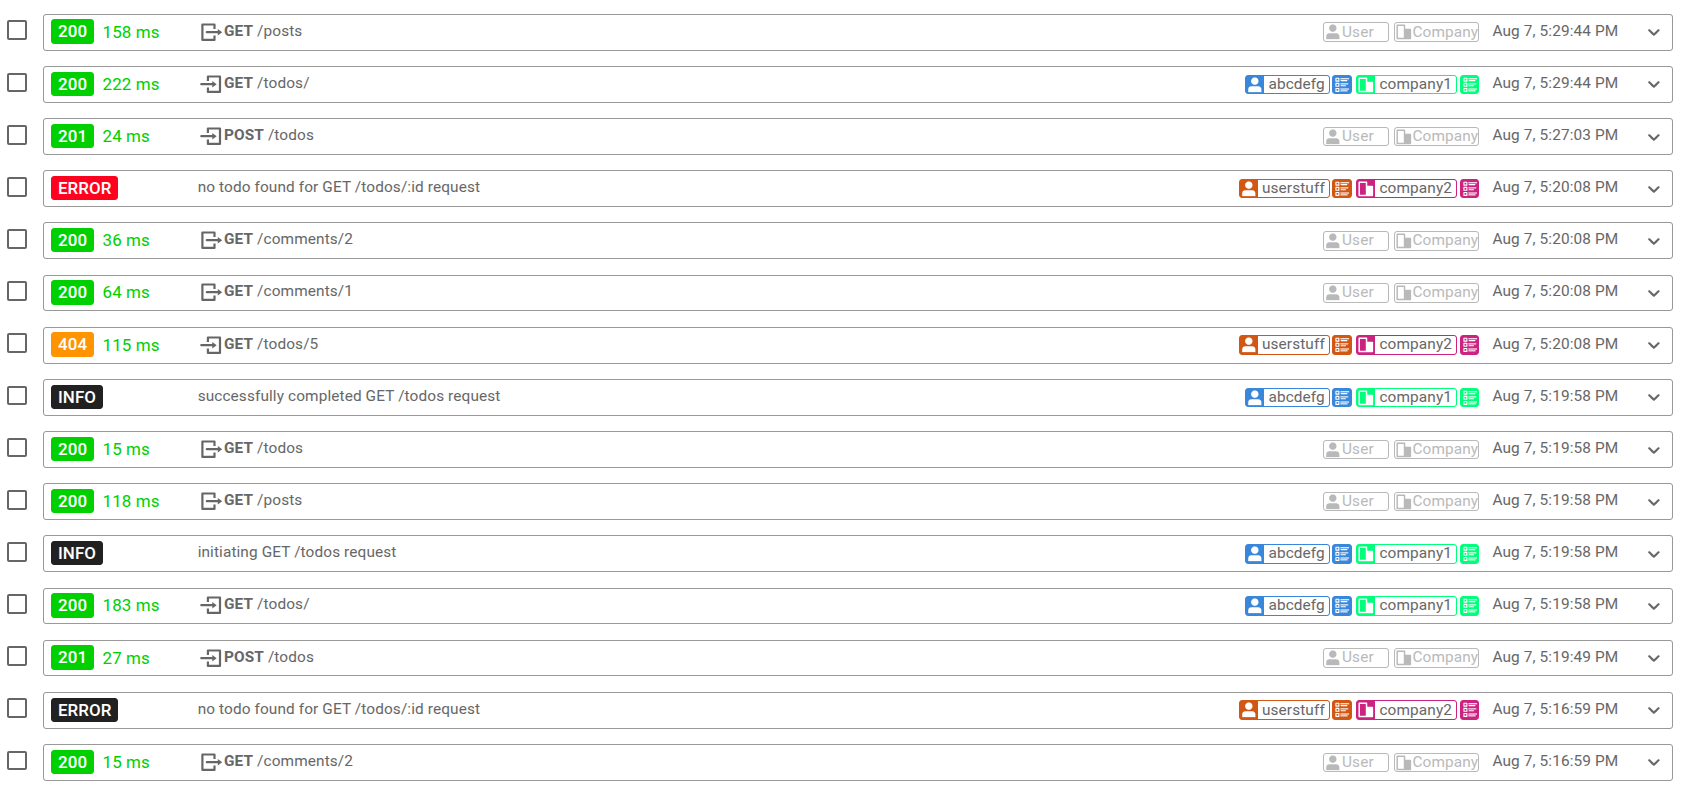
As your application runs, OpenTelemetry should start sending log data to Moesif. Open a Live Event Log workspace in Moesif and you should see logs appear:
Analyze OTel Logs in Moesif
Once you have logs flowing into Moesif in real time, you have more control and finesse over your analytics, for example:
- Search and filter in Live Event Log: Quickly isolate log entries or API activities by status code, trace and span data, or log-specific fields and attributes.
- Build Time Series: Track error rates or other metrics over time.
- Segment by different criteria: Compare error volume by service, region, or deployment version.
- Visualize on geo heatmaps: See where errors originate geographically.
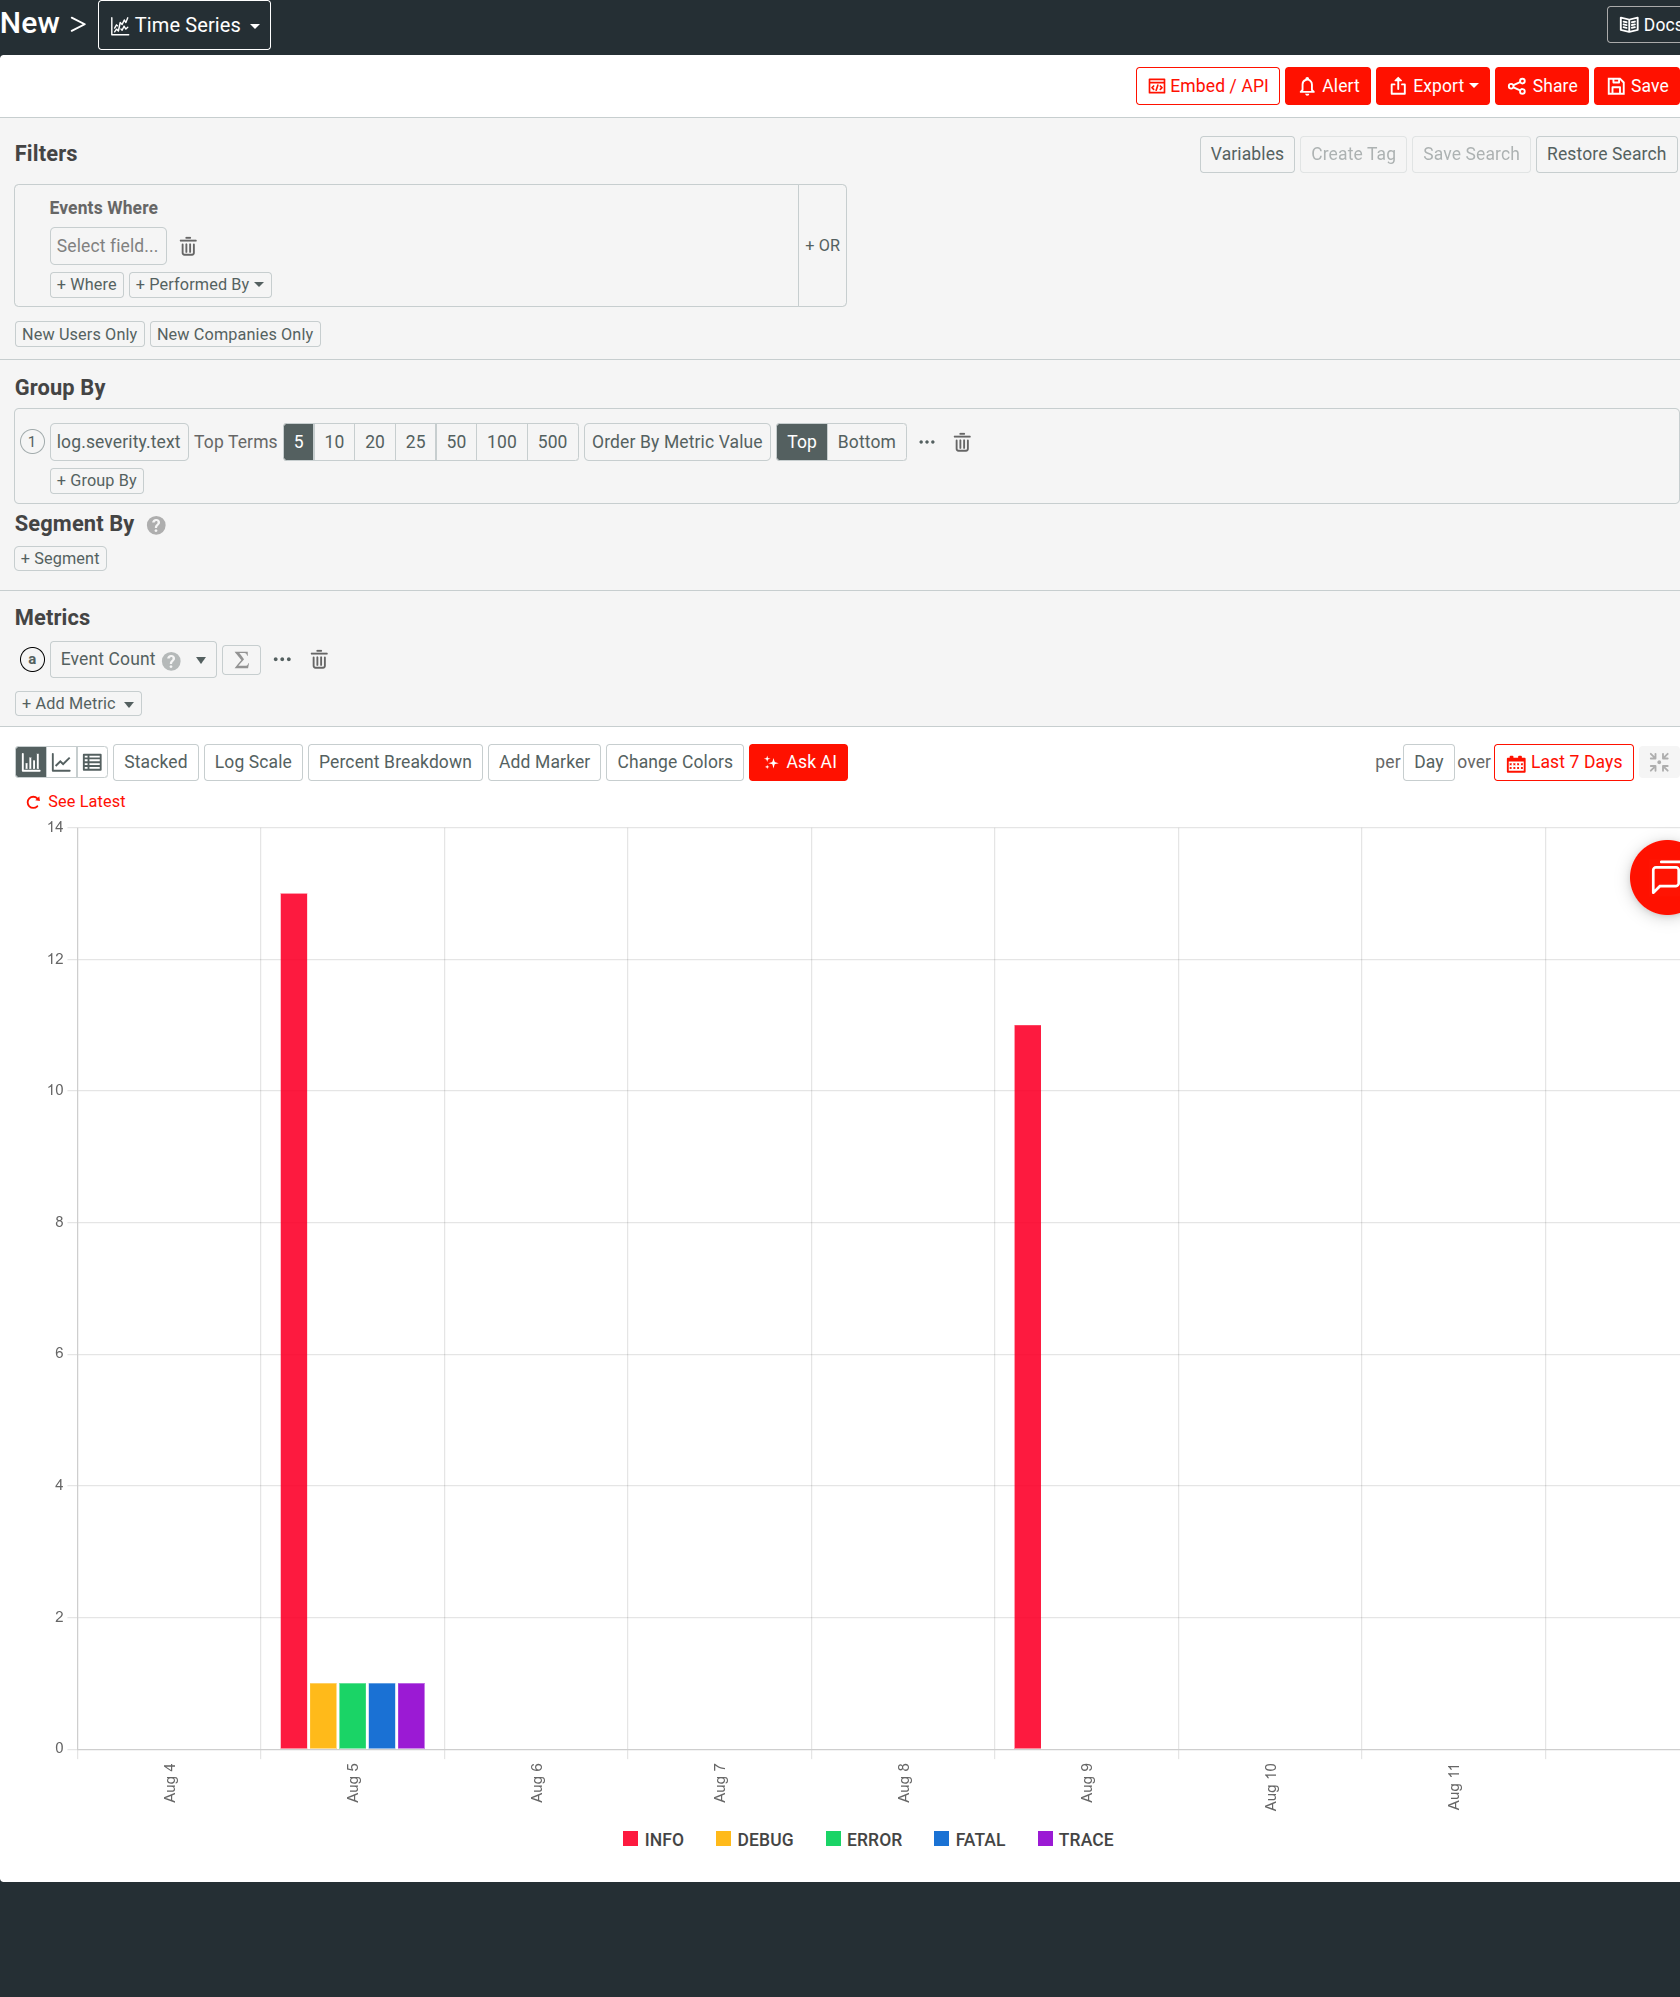
Here’s an example of looking at logs by their severity levels in a Time Series.
Why Use Moesif for OTel Logs?
We’ve purpose-built Moesif for high-cardinality, high-dimension analytics. Now we’re extending that to telemetry data like traces and logs. So you can:
- Filter and group logs across millions of unique values
- Correlate log patterns with API performance trends
- Use familiar Moesif dashboards, workspaces, and other utilities to investigate incidents faster.
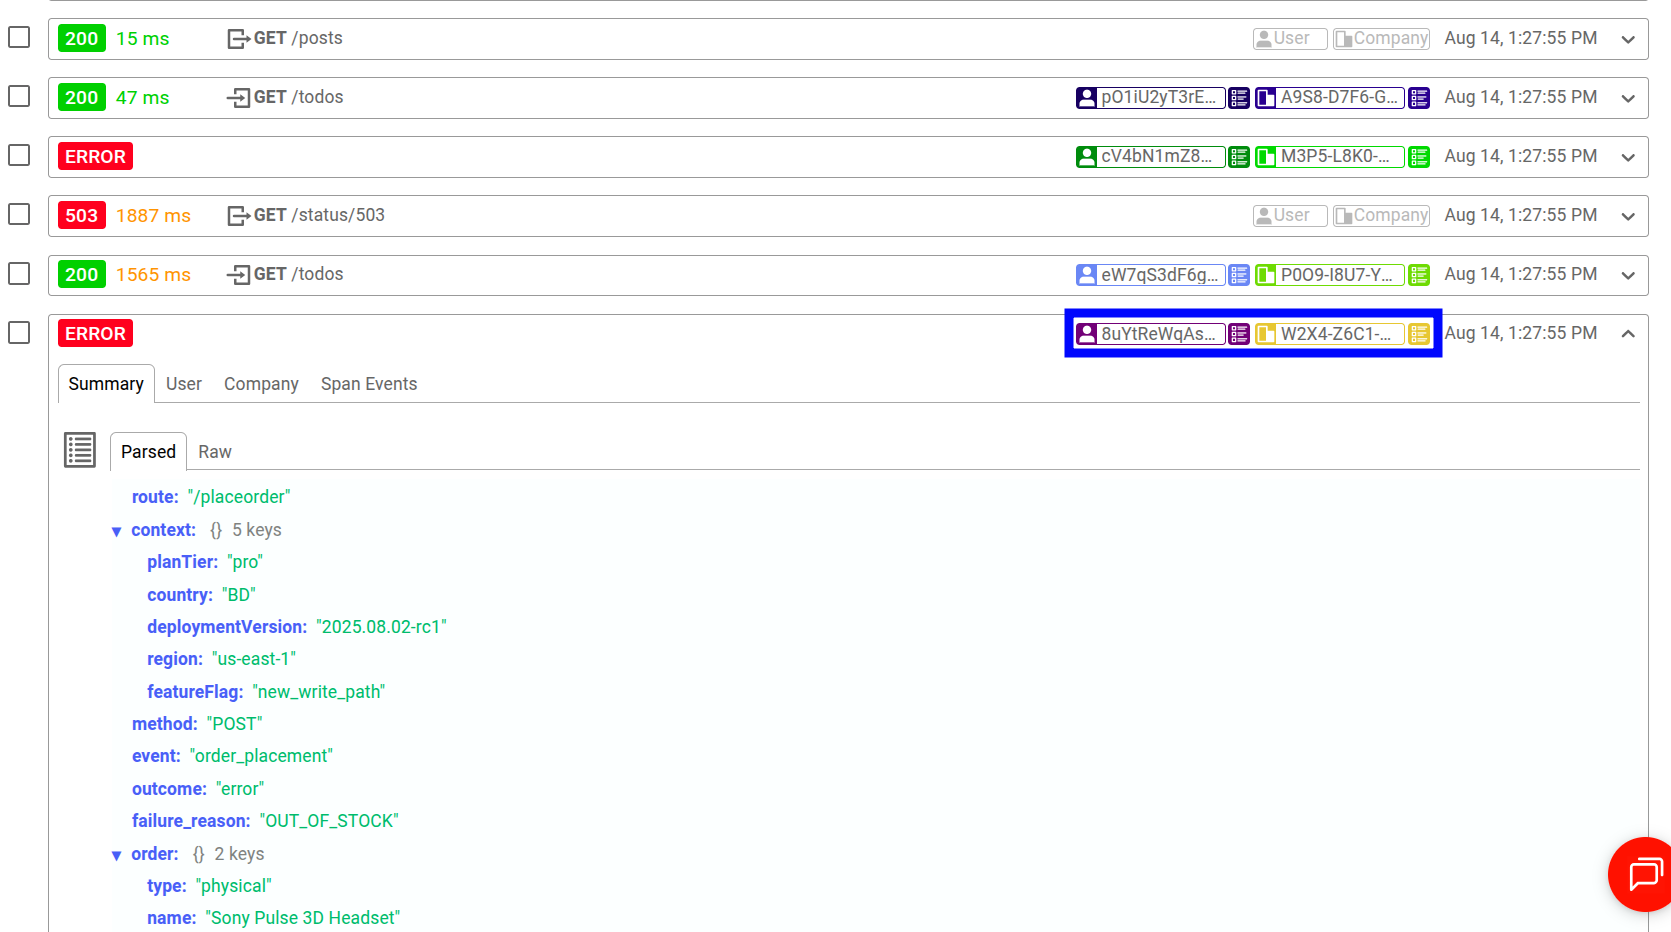
If you have set up customer identification, you can pivot to the customer profile screen from a Live Event Log workspace and get more info on exactly who’s impacted.
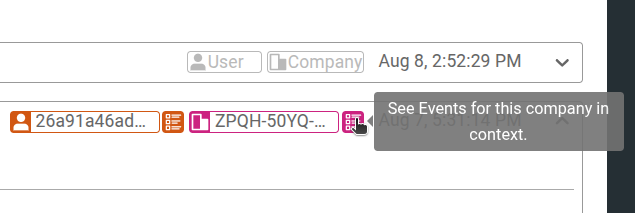
You can also observe all events associated with a user or company in the current context:
Correlate Trace and Log Data in Moesif
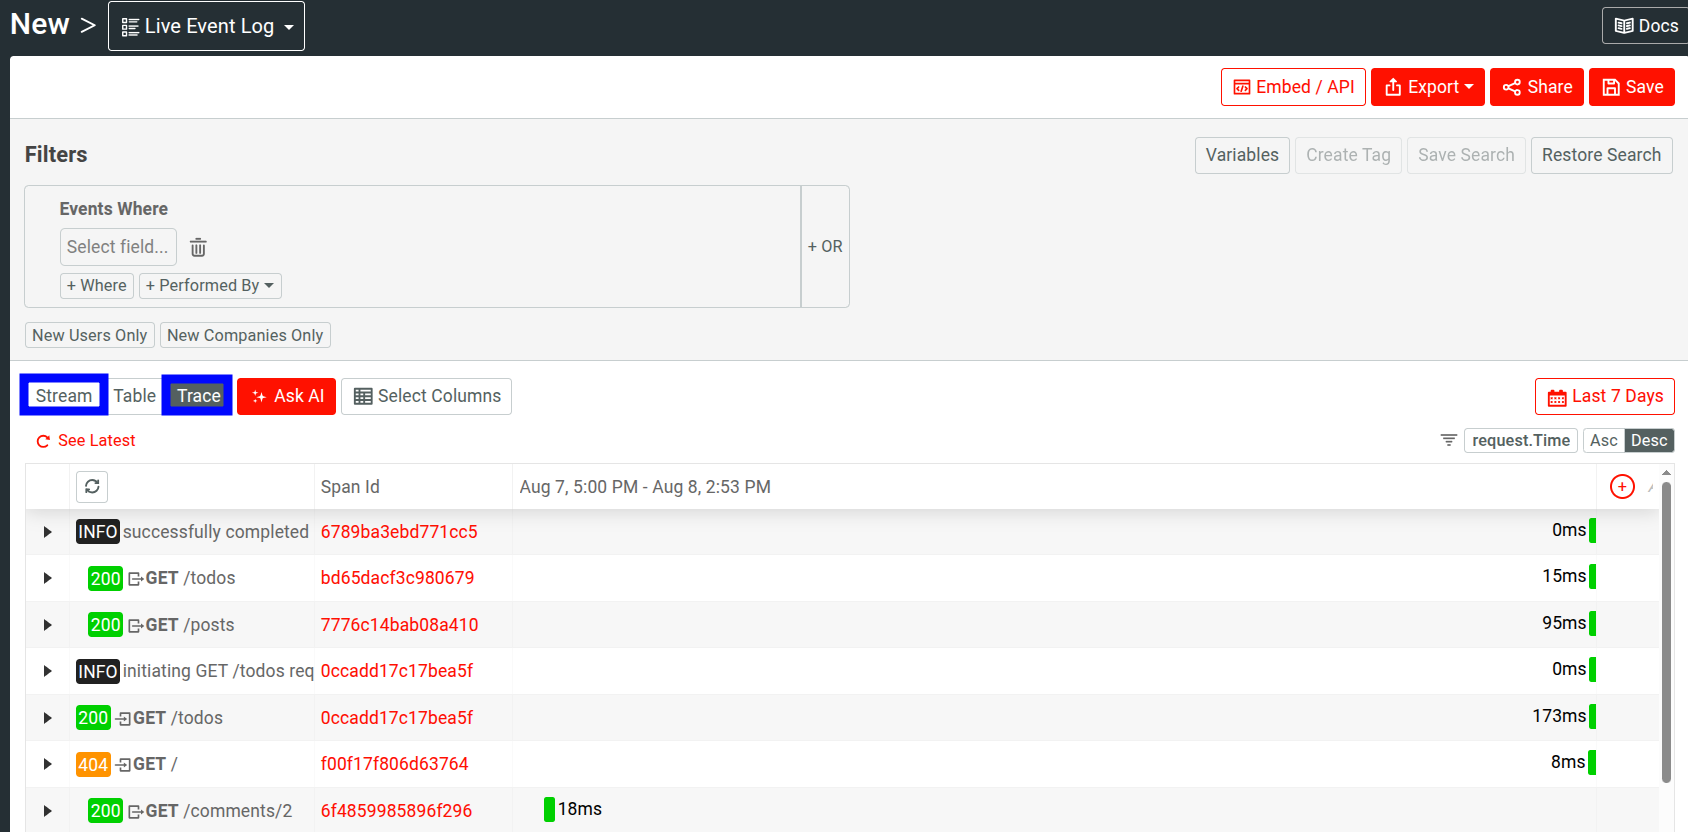
Moesif’s Live Event Log allows you to view your API traffic interactively through different lenses so you can navigate between API calls, custom actions, and telemetry data.
OpenTelemetry automatically injects trace and span IDs into logs. So a log message emitted during the execution of a specific span will include the trace ID and span ID of that active span.
In Moesif, you can view logs associated with a specific span or trace in both Stream and Trace views:
In Stream view:
- Expand an API event element.
- Select the trace ID or span ID value.
- Select Open trace or Open span.
In Trace view, select the span ID, or expand the API event element and then follow the same steps.
Best Practices
Structured JSON in your logs will unlock powerful analytics and possibilities for you through Moesif. Emit JSON bodies that:
- Describe the domain event (what happened)
- Mirror a minimal set of dimensions into attributes, to help with filtering and defining metrics
The log attributes appear as metadata in Moesif. Favor attributes that make filtering and grouping useful, and therefore contextual analysis more constructive in Segmentation, Time Series, and Geo Heatmaps.
Here are some tips to make the best out of OpenTelemetry logs in Moesif:
Model Domain Events
In the log body, include fields that mirror domain events and contextual details, like request method, route, and outcome (successes and errors). This gives you stable semantics across services and helps build consistent charts.
Mirror Only Filterable Dimensions Into Attributes
Keep attributes lean and stable. For example:
http.routeuser.idcompany.idregioncountrydeployment_versionfeature_flag
Use lowercase keys and avoid spaces and mixed types.
Attach Release and Experiment Context
Attach deployment version, feature flags, and A/B testing variant data so you can segment errors by release or experiment in Segmentation and Time Series. It often provides the fastest way to prove or disprove a regression.
Treat High-Cardinality With Intent
Include IDs you actually filter on, like customer, trace, and span IDs. Keep unbounded text, like stack traces and full messages, in the log body, not attributes. This preserves query performance while keeping rich details available in an idiomatic way.
Add trace Context
Moesif allows you to open a trace and observe every span and log event within that trace. Despite that, we recommend you include trace and span IDs in log attributes. It makes correlation and filtering more dynamic and easier. And if you export your data out of Moesif, having those IDs inline in attributes makes correlation easier.
Sampling
Moesif’s dynamic sampling doesn’t apply to the ingested OpenTelemetry data. So you must configure sampling manually in your OpenTelemetry setup. Ensure stable sampling to avoid situations like biased Segmentation when comparing regions or releases.
Privacy and Governance
Avoid PII in attributes. If you require PII in the body, use redaction or hashing. Never log secrets or tokens. Keep customer IDs synthetic and stable. This keeps your analytics useful without creating or exposing your systems to risks.
Get Started Today
See the OpenTelemetry integration docs to get started. You can also get up and running by walking through our Integrating with OpenTelemetry guide that features an example Node.js application.


