Achieving API Traceability with OpenTelemetry and Moesif
APIs power complex and modern applications and in doing so they’ve also become a challenge to observe, monitor, and analyze. Even the apps we rely on daily consists of numerous services, each glued together by dedicated APIs that interact with one another in intricate ways. In today’s market, you have to make sure that API complexity doesn’t hurt the visibility you need to possess into your product.
Using an industry-standard observability framework like OpenTelemetry, you can guarantee that APIs generate the raw data necessary to effectively monitor and debug your application in real time. With Moesif’s OpenTelemetry integration, you have a consolidated platform where you can leverage Moesif’s robust API analytics and observability features contextually with OpenTelemetry traces.
Let’s explore how Moesif can help you foster a clearer picture of what happens in your system and drive growth with precise business decisions.

Table of Contents
- OpenTelemetry Primer
- How Moesif OpenTelemetry Integration Works
- Install Moesif OpenTelemetry Integration
- Observe Trace Data in Moesif
- Conclusion
- Next Steps
OpenTelemetry Primer
OpenTelemetry provides a standardized way to add instrumentation to your application so it can generate data about its execution as the app runs. This data includes metrics, logs, and traces. You can then collect and analyze the data to understand your application’s performance, identify bottlenecks, and debug distributed systems. OpenTelemetry is vendor-agnostic, meaning it doesn’t matter what backend you use to collect and analyze OpenTelemetry data.
OpenTelemetry Basic Concepts
The telemetry data OpenTelemetry creates and manages consist of three core types:
- Logs
- Metrics
- Traces
Logs
Logs provide textual records of specific events, errors, or states in an application. They represent discrete events during an app’s runtime, for example, an error message, a user login, or the application starting up. Each log entry includes a timestamp indicating when the event occurred. Logs can follow a structured format, like JSON, or be unstructured like free-form text. Logs also often includes contextual information like severity level, source, and metadata.
Traces
OpenTelemetry traces help understand the full path of a request through your application. In doing so, you also get a clear picture how the different services interact and function to satisfy the request.
Traces consist of spans. Each span represents individual operations.
For example, consider an ecommerce order. The entire process of fulfilling a user’s order, from the user placing the order through the website to delivery confirmation, represernts a trace. Then the following individual steps in this process each constitute a span associated with the trace:
- API Call
- Creating the order after receiving the order details
- Database query
- Checking the inventory to verify product availability
- API call
- Using the payment gateway to processes the payment
- Message queue
- Sending to delivery system or warehouse to notify shipping to customer
- API call
- Updating the order status to confirms order completion
Metrics
OpenTelmetry metrics capture numerical measurements of an applications performance and behavior over time. Here are some examples of metrics:
- Error rates
- Resource usage like CPU and memory consumption
- Number of active users
Metrics differ from logs and traces in that they focus on quantifiable measurements rather than individual events or request flows. For example, consider request your API receives to access a particular resource:
- A metric tells you that the request latency is 200ms.
- A trace illustrates the end-to-end journey of the request and the specific steps the request involved for fulfilling it.
- A log records the details of an error that has occurred during the request.
How Moesif OpenTelemetry Integration Works
The integration works by configuring your OpenTelemetry Exporter to send trace data to Moesif using the OTLP/HTTP protocol.
Moesif supports OpenTelemetry traces and logs. It doesn’t support metrics. Within traces, Moesif supports HTTP Spans, capturing HTTP request span data that follows the OpenTelemetry Semantic Conventions for HTTP Spans. For logs, Moesif receives a structured log event for each log record that you can correlate with traces.
Moesif treats each OpenTelemetry HTTP request/response span as an API event, capturing key information like request and response details, user identification, and metadata.
Moesif maps OpenTelemetry spans to its API event model. It treats each span as a single API event with the addition of Trace ID, Span ID, Parent Span, Span Lin ks, and metadata.
For more information about how Moesif maps different span elements and log record fields, see the following:
Besides request and response spans, Moesif also supports the following:
- Span Events
- Custom Span Attributes
- Request and response bodies
- User, Company, and Subscription tracking
Install Moesif OpenTelemetry Integration
To install and start using Moesif OpenTelemetry integration, make sure to meet the following requirements first:
- You have an application have instrumented with OpenTelemetry SDKs. Alternatively, you have configured your application to send telemetry data to an OpenTelemetry Collector capable of exporting through OTLP over HTTP.
- A Moesif account.
Step 1: Configure the OpenTelemetry Exporter
Set up your OpenTelemetry SDK to export trace and log data to Moesif through OTLP/HTTP protocol.
Example YAML Configuration
   exporters:
     otlphttp:
       endpoint: https://api.moesif.net/v1/traces
       headers:
         X-Moesif-Application-Id: 'YOUR_MOESIF_APPLICATION_ID'
     otlphttp/logs:
       endpoint: https://api.moesif.net/v1/logs
       headers:
         X-Moesif-Application-Id: 'YOUR_APPLICATION_ID'
Example Configuration Using Environment Variables
   # Set the OTLP endpoints
   export OTEL_EXPORTER_OTLP_TRACES_ENDPOINT=https://api.moesif.net/v1/traces
   export OTEL_EXPORTER_OTLP_LOGS_ENDPOINT=https://api.moesif.net/v1/logs

   # Include your Moesif Application ID in the headers
   export OTEL_EXPORTER_OTLP_HEADERS=X-Moesif-Application-Id=YOUR_MOESIF_APPLICATION_ID
Replace _YOUR_MOESIF_APPLICATION_ID_ with your Moesif Application ID. To
get your Application ID, follow these steps:
- Log into Moesif Portal.
- Select the account icon to bring up the settings menu.
- Select Installation or API Keys.
- Copy your Moesif Application ID from the Collector Application ID field.
Step 2: Set Up Authentication
Make sure to include your Moesif Application ID in the X-Moesif-Application-Id
request header to authenticate requests.
Step 3: Run Your Application
Start your application, and OpenTelemetry begins sending trace data to Moesif.
Observe Trace Data in Moesif
The trace data Moesif collects for your application becomes available in Live Event Log workspaces. Live Event Log shows a real-time continuous record of all the API events like API calls and actions that take place within your application or services. With OpenTelemetry trace data, you can better contextualize and understand your application’s behavior, performance, and states. Let’s look at some of the features Moesif offers to leverage your application’s telemetry data.
View Trace Data
Select the Trace View tab to view the trace data of your application’s events.
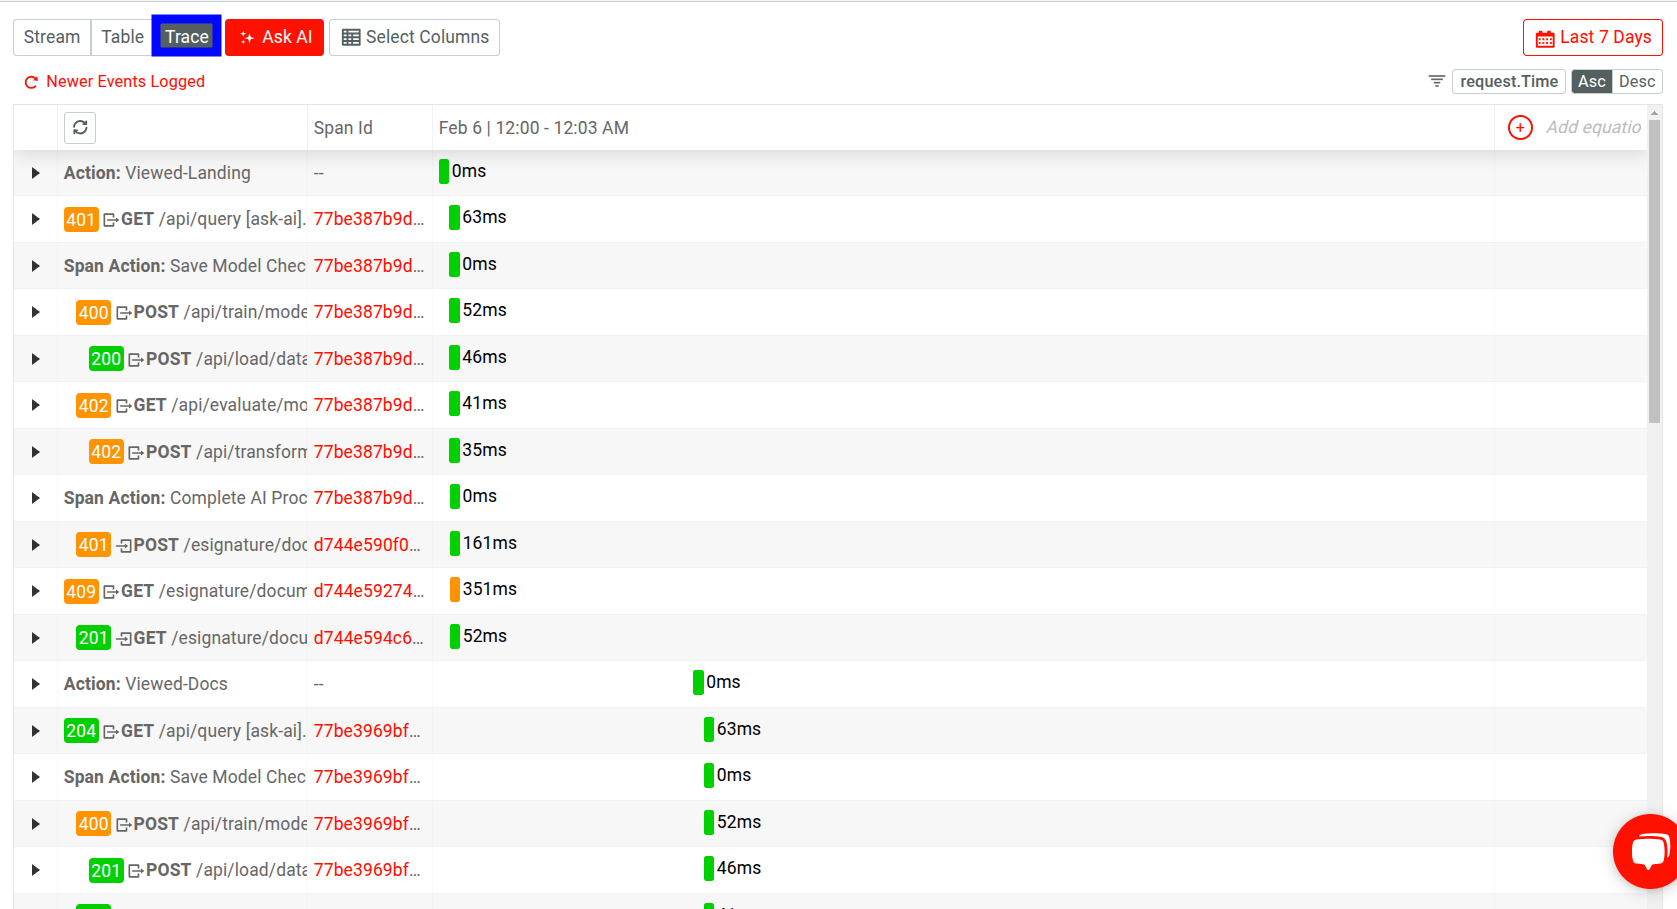
Trace View breaks down event data into spans. By default, it shows you the following details:
- Span IDs
- The duration of each span
- Contextual data:
- HTTP request and response data
- Span Event as Span Action
- Custom actions as Action
Dig Deeper Into Trace Data
Interacting with an element opens up a detailed view about the event:
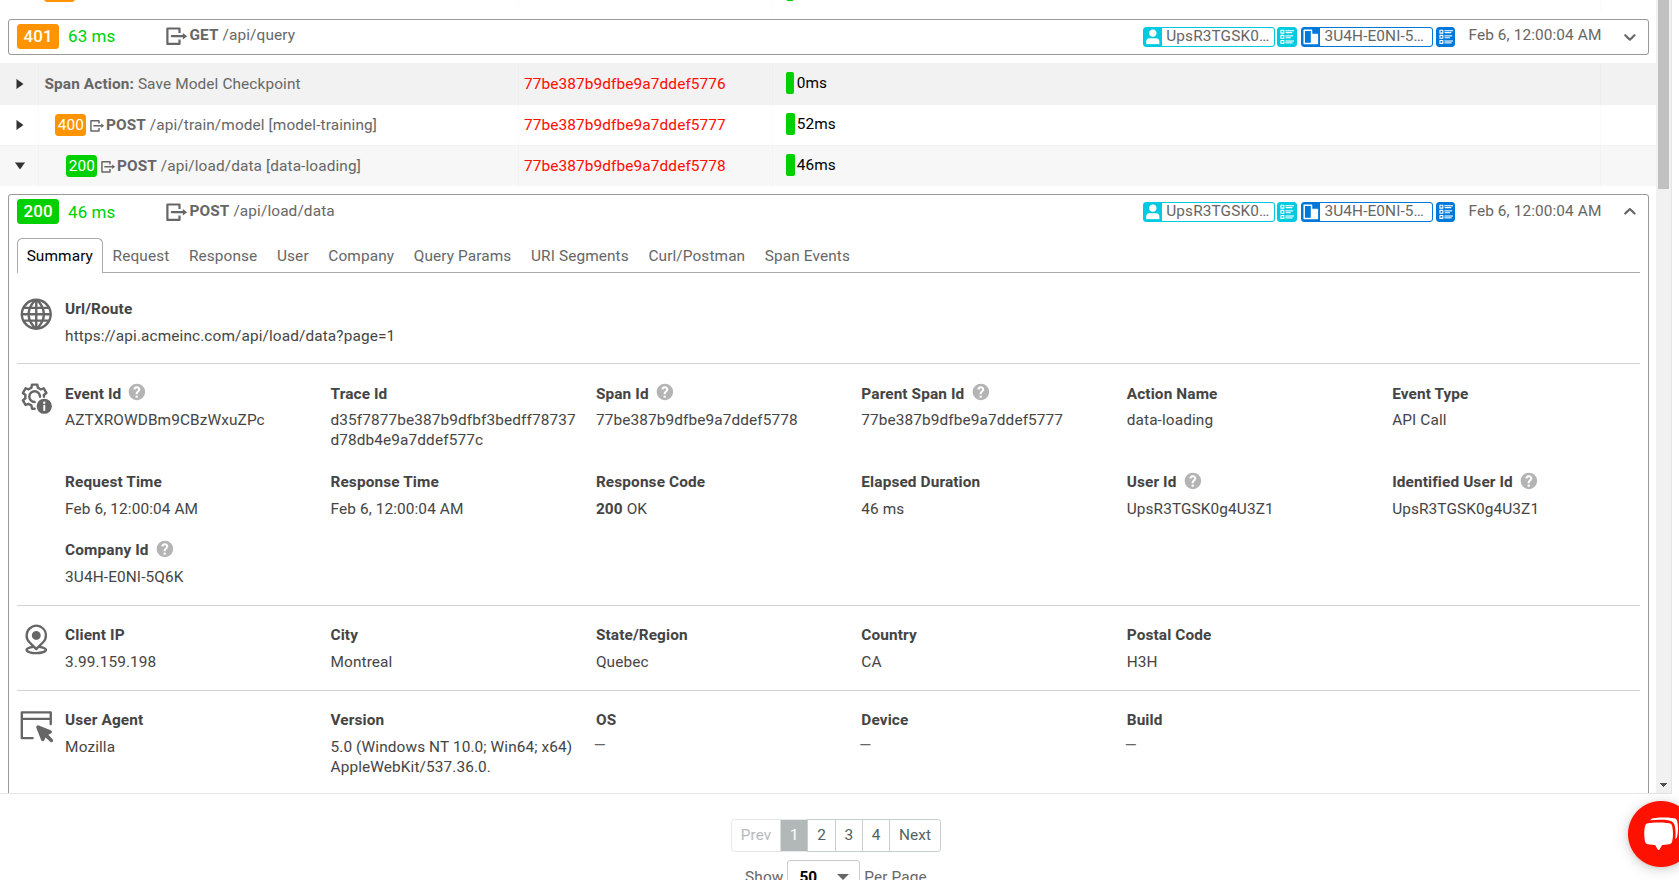
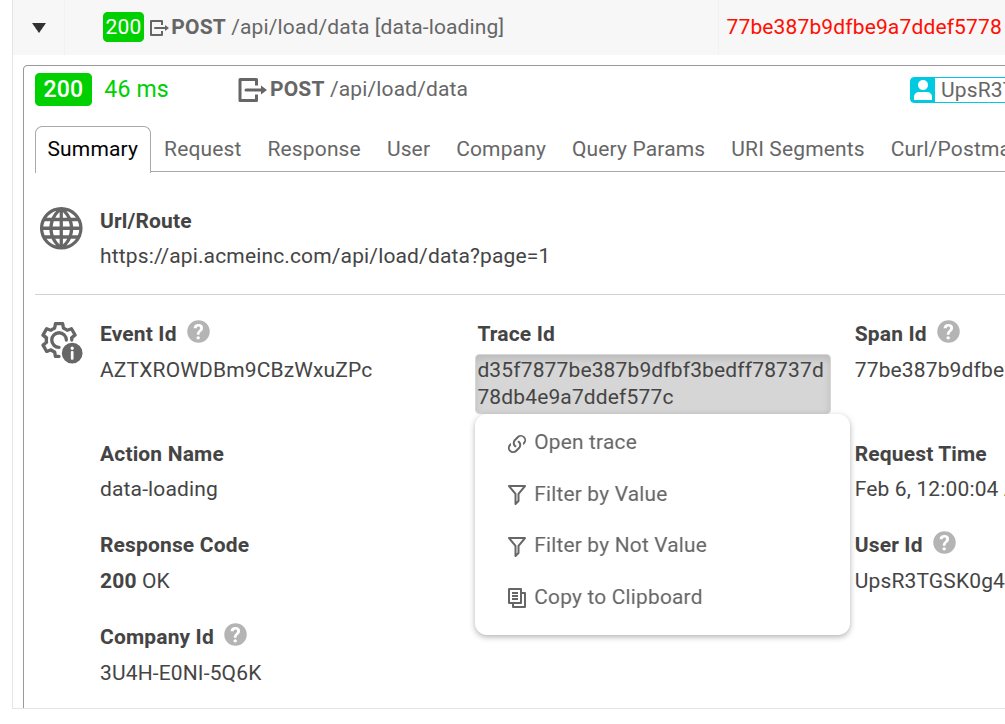
You can interact with individual event data fields and field values in the detailed view:
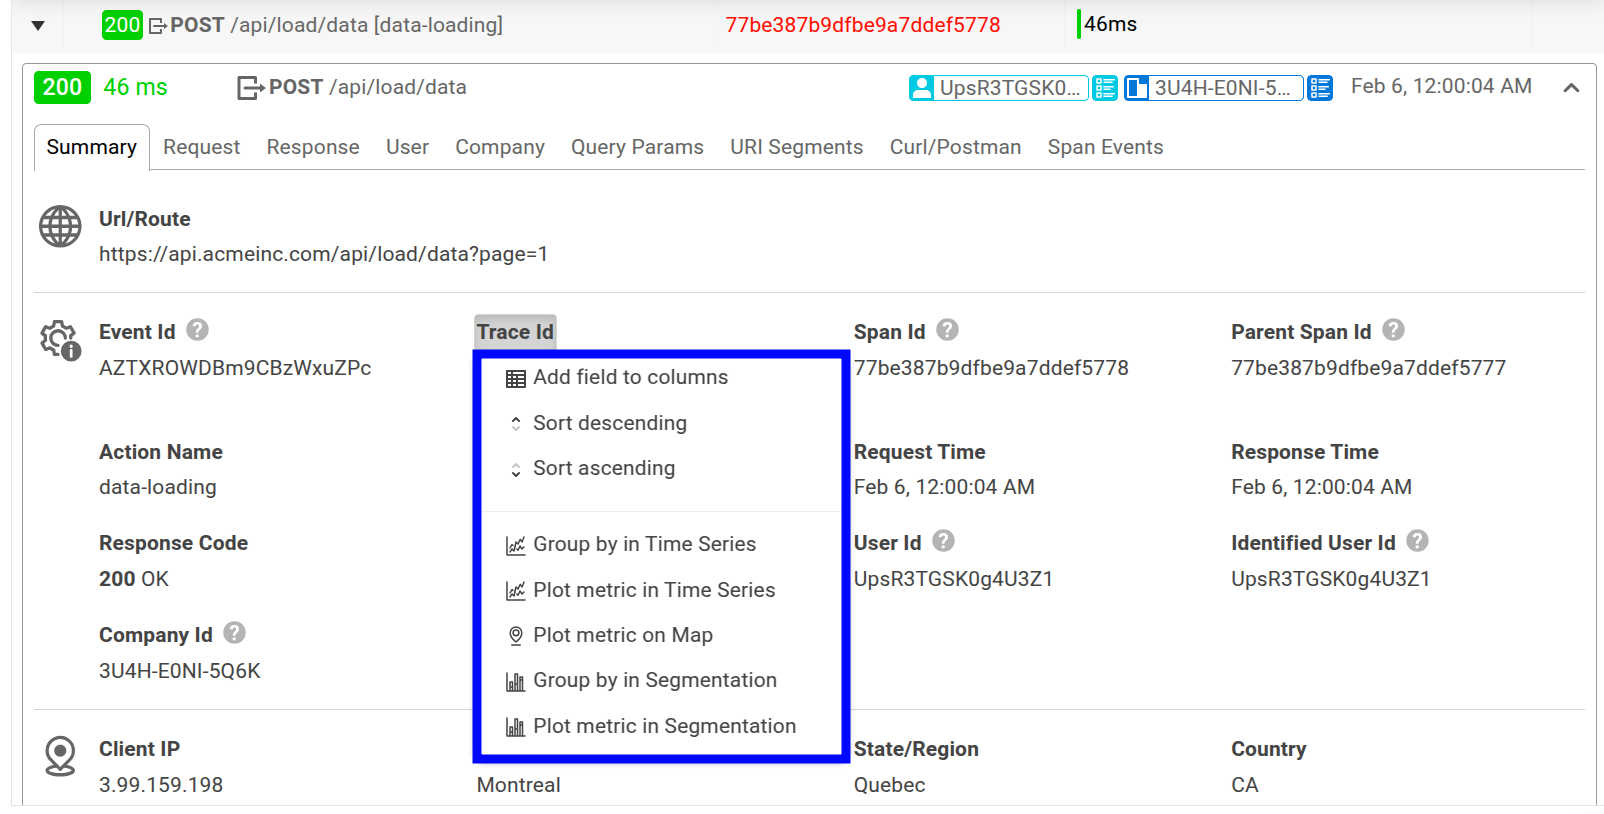
In the dropdown, you can view more detailed information about the data element and perform further actions on that specific data. For example, depending on the data type, you can filter and sort, plot the data as a metric in a different chart, and so on.
In the preceding image, if you select the trace ID value instead of the Trace Id field name, you can select Open Trace to view details about the trace the span is a part of. Moesif then displays the individual spans that constitute the trace.
For example, let’s consider you have a machine learning API that allow querying
existing models, training, and evaluation. You can choose to open the trace for
a failed GET request to the /api/query endpoint:
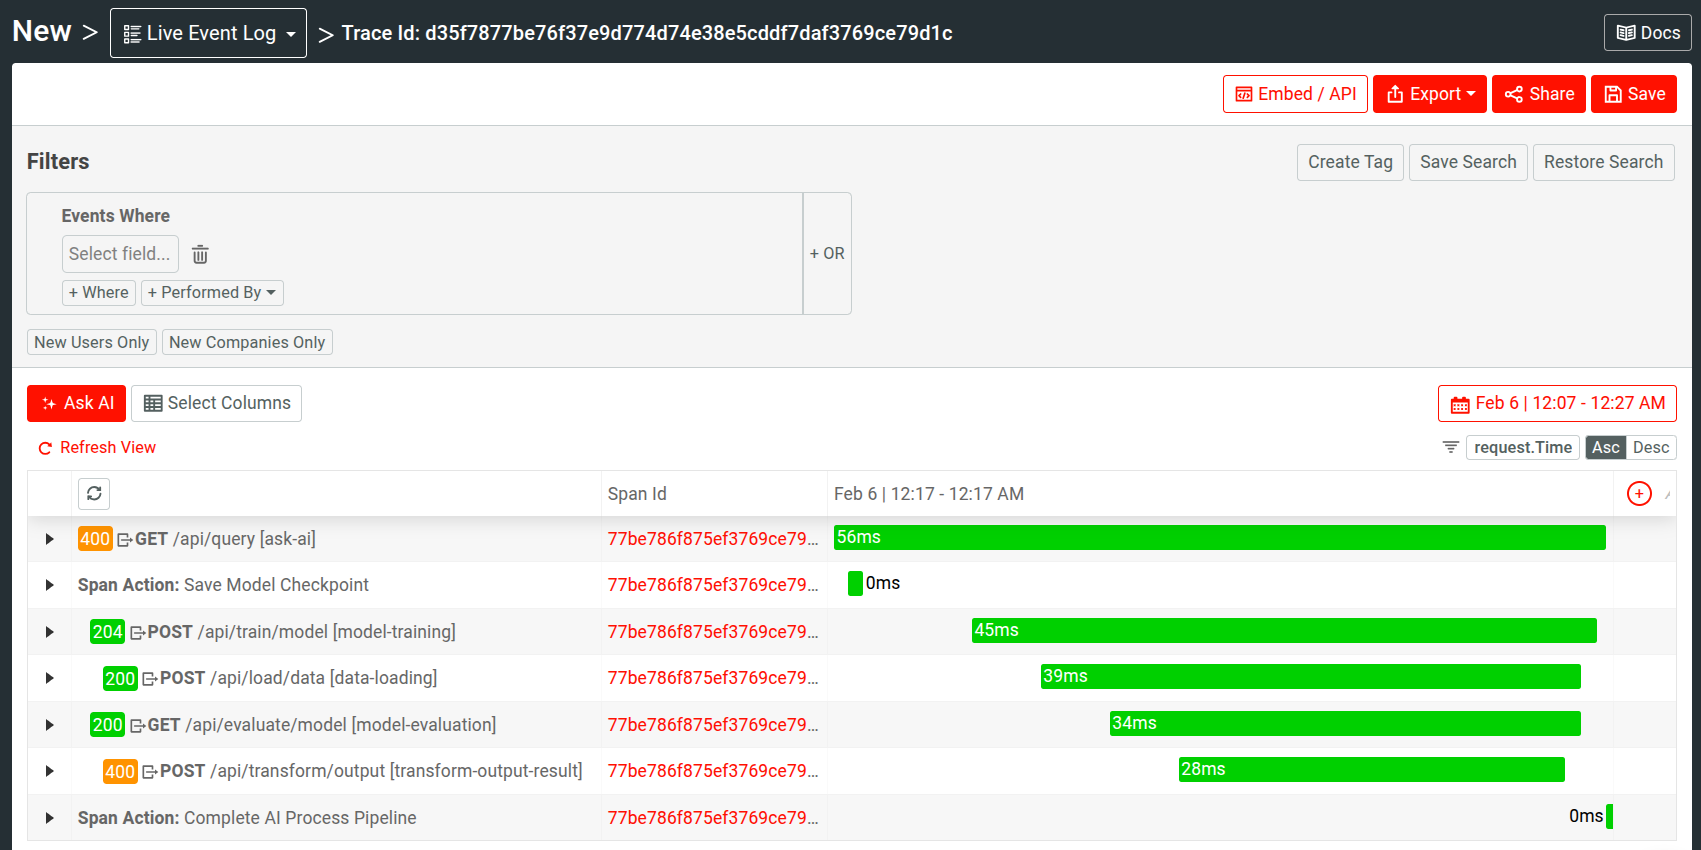
From here, we observe the exact cause of failure: a POST request to the
/api/transform/output endpoint has failed with an HTTP 400 Bad Request status
code.
Use Trace Data Elements For Granular Analyais
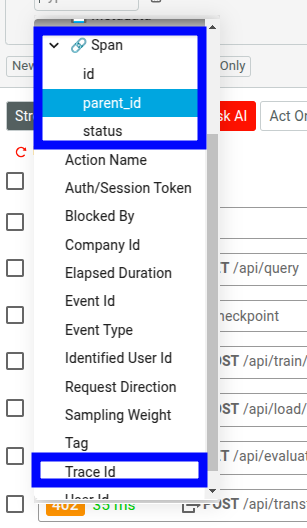
Additionally, you can use different trace data as event filters across different API and customer analysis types in Moesif.
Use Artificial Intelligence To Debug Issues With Traces
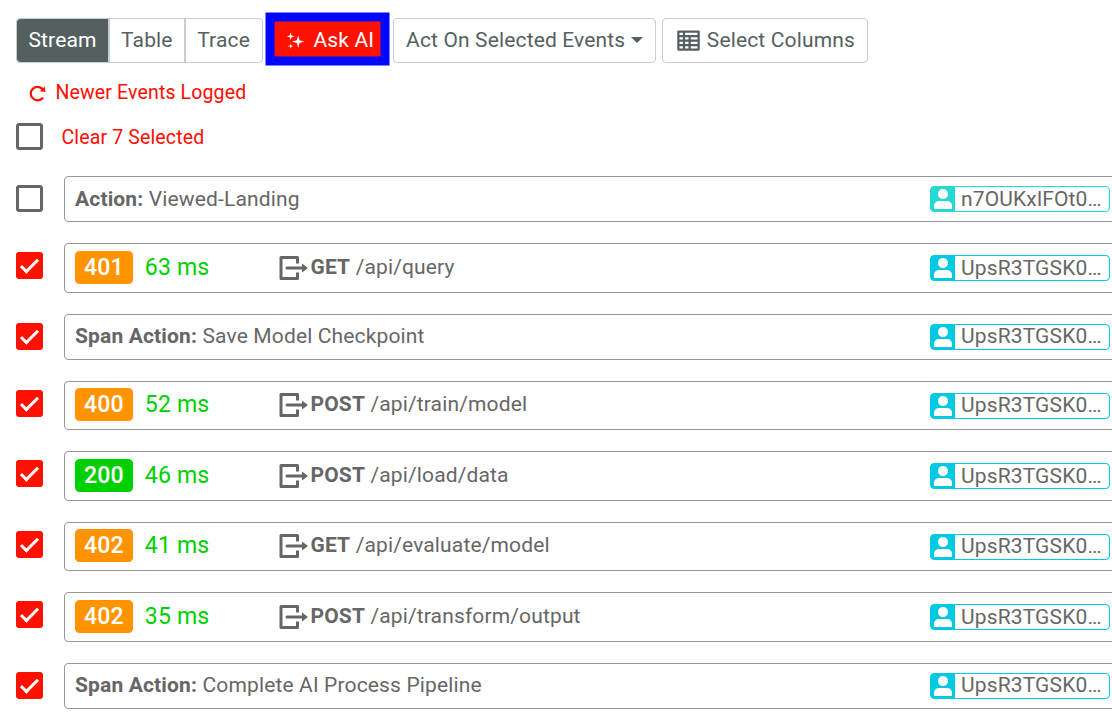
In your Live Event Log workspace, select a number of events in Stream view and then select Ask AI. This brings up an AI-powered conversational interface where you can to ask questions, dig out critical information quickly, and troubleshoot issues more effectively.
Conclusion
Moesif’s OpenTelemetry integration greatly improves your API’s observability and the existing benefits of Moesif’s robust API analytics and monitoring tools. To try out Moesif for yourself and see how it can help you monitor, analyze, and grow your APIs more effectively, sign up today for a free trial, no credit cards required.
Next Steps
- Explore the OpenTelemetry documentation
- See Moesif OpenTelemetry server integration docs.
- Instrument your Node.js app with OpenTelemetry and integrate Moesif.
- Explore other server integrations from Moesif.


