How Engineering Teams Should Monitor Customer Health and API Usage
Most engineering teams have infrastructure monitoring nailed down—they are tracking uptime, latency, and error rates, and have set up alerting in places. But API issues don’t always start there.
Infrastructure metrics don’t tell you how your API users experience your API. A critical integration may have been repeatedly facing failures due to invalid authentication tokens. A new version you have deployed might have introduced a subtle schema change that breaks older clients. These issues don’t surface in your logs until someone complains or churns.
That is where you need customer-level API observability. With Moesif, engineering teams can see not just whether the API is responding, but how it is being used—and by whom. You can track which clients are sending malformed requests, identify usage regressions before they escalate, and build alerting systems based on real user behavior.
In this article, we will walk through how to monitor API usage with engineering precision—from debugging in production to catching issues your logs miss.

Table of Contents
- Rethinking API Monitoring for Engineering Teams
- What Healthy API Usage Looks Like
- Account Health from an Engineering Lens
- Debugging and Alerting in Production
- Wrapping up
Rethinking API Monitoring for Engineering Teams
Most engineering teams associate monitoring with system-level metrics: response latency, CPU load, memory usage, and service uptime. However, they only reflect the infrastructure’s performance, not the behavior of API clients consuming your web services. API monitoring, done right, offers insights into how your APIs are used—not just whether they are up.
This distinction matters because APIs don’t only function as transport mechanisms. Web APIs and web servers build the contracts between your system and the outside world: mobile apps, third-party integrations, frontend clients, or even internal teams. Each API call represents a decision an external system makes. Infra metrics doesn’t tell you when a partner misuses your authentication tokens or when a public API client unknowingly sends malformed payloads after a version change.
Traditional monitoring tools also fall short in account-level visibility. Engineers often want to answer questions like these:
-
Which API clients are causing
401 Unauthorizederrors due to expired tokens? -
Are newly onboarded users actually calling the API, or stalling after signup?
-
Has a recent API change increased the error rate or reduced request volume?
These aren’t infrastructure concerns—they’re product-integrated behaviors. The following table illustrates some examples.
| What you monitor | Infra monitoring (Datadog, Prometheus) | Moesif API observability |
|---|---|---|
| API server uptime | Check if the service is running | No visibility into how it is being used |
Auth errors (401, 403) |
Often aggregated, lacks context | Can tie to specific API clients or tokens |
| Deprecated endpoint usage | Not tracked | Detect clients using outdated APIs |
| Retry storms or rate limits | May go unnoticed unless impacting infra | View by client, IP, or endpoint |
| Drop-off after onboarding | Invisible | Funnel analysis tied to API behavior |
| High-value account usage | No account mapping | Group API calls by user or account ID |
| Breaking change detection | Requires manual correlation | Detect schema or behavior regressions |
| Webhook or API consumer issues | No client-side feedback loop | Monitor and alert on failed deliveries |
Moesif enables engineers to trace these behaviors to specific API keys, endpoints, and accounts. You don’t replace tools like Prometheus or Datadog, but complement them with observability at the edge where systems interact.
Another common gap is that traditional monitoring tools don’t offer session context. Engineers trying to debug failed API requests often jump between logs, request traces and logs, and support tickets. Moesif simplifies this by allowing you to group API usage by client, user, or account. By tying requests to clients, this context uncovers patterns such as a malfunctioning integration triggering a 5XX retry storm—issues that infrastructure dashboards tend to smooth over.
Engineering teams need API monitoring that moves beyond HTTP 200s and server health. The focus shifts to understanding client behavior, identifying integration failures early, and correlating API usage with product outcomes.
What Healthy API Usage Looks Like
Uptime is not a proxy for API health. An API can return HTTP 200s all day while silently failing its users. For engineering teams, understanding API health means going beyond status codes and measuring how APIs are used, by whom, and with what effect.
Healthy API usage shows up in patterns of consistent, intentional interaction. These patterns often include predictable request volume, low client-specific error rates, and interaction across multiple API endpoints that align with expected workflows. For example, consider an API that supports embedding generation followed by semantic search:
-
POST /v1/embeddingsto vectorize input text -
POST /v1/searchto query a vector index
You expect clients to call both endpoints in tandem, often within the same session. If users consistently hit only the embeddings API endpoint without ever querying, that may signal misuse—like caching abuse, onboarding friction, or an incomplete integration.
You also want to track endpoint diversity. A client hitting only one endpoint over time might be under-integrated, misconfigured, or using the API in ways you or the customer doesn’t intend to. Healthy usage tends to spread across several endpoints—authentication, metadata fetches, user actions—revealing alignment with your intended API surface.
Errors constitute another important dimension. A low global error rate doesn’t mean everything is fine. Engineers need to know which clients, endpoints, or API keys are generating errors, and in what context. One account might cause 90% of your 403 responses due to expired authentication tokens, or flood your system with 422 errors from malformed payloads. Without client-level granularity, these problems go undiagnosed.
Latency patterns follow the same rule. Average latency across all API calls doesn’t tell you which customer is experiencing delays. Healthy usage means consistent and optimal performance across accounts. If one client sees persistent slowdowns on GET /invoices, they may be sending expensive filter queries—something infrastructure monitoring alone doesn’t reveal.
Finally, healthy API behavior looks intentional.
-
Are clients authenticating before making calls?
-
Are they hitting documented endpoints in a logical sequence?
-
Are calls spaced in a way that reflects real user behavior—not automated scripts or misbehaving integrations?
You can differentiate real usage from noise by observing intent.
Using Moesif to Observe Healthy and Unhealthy Patterns
With Moesif’s ability to group requests by different parameters like API key, user ID, or company, engineers can zoom into usage patterns that matter, and act before issues escalate. Here are some examples:
Example: Spotting Onboarding Drop-off with Behavioral Funnels
Suppose your intended onboarding flow involves these steps:
-
POST /signup -
GET /profile -
POST /data/upload
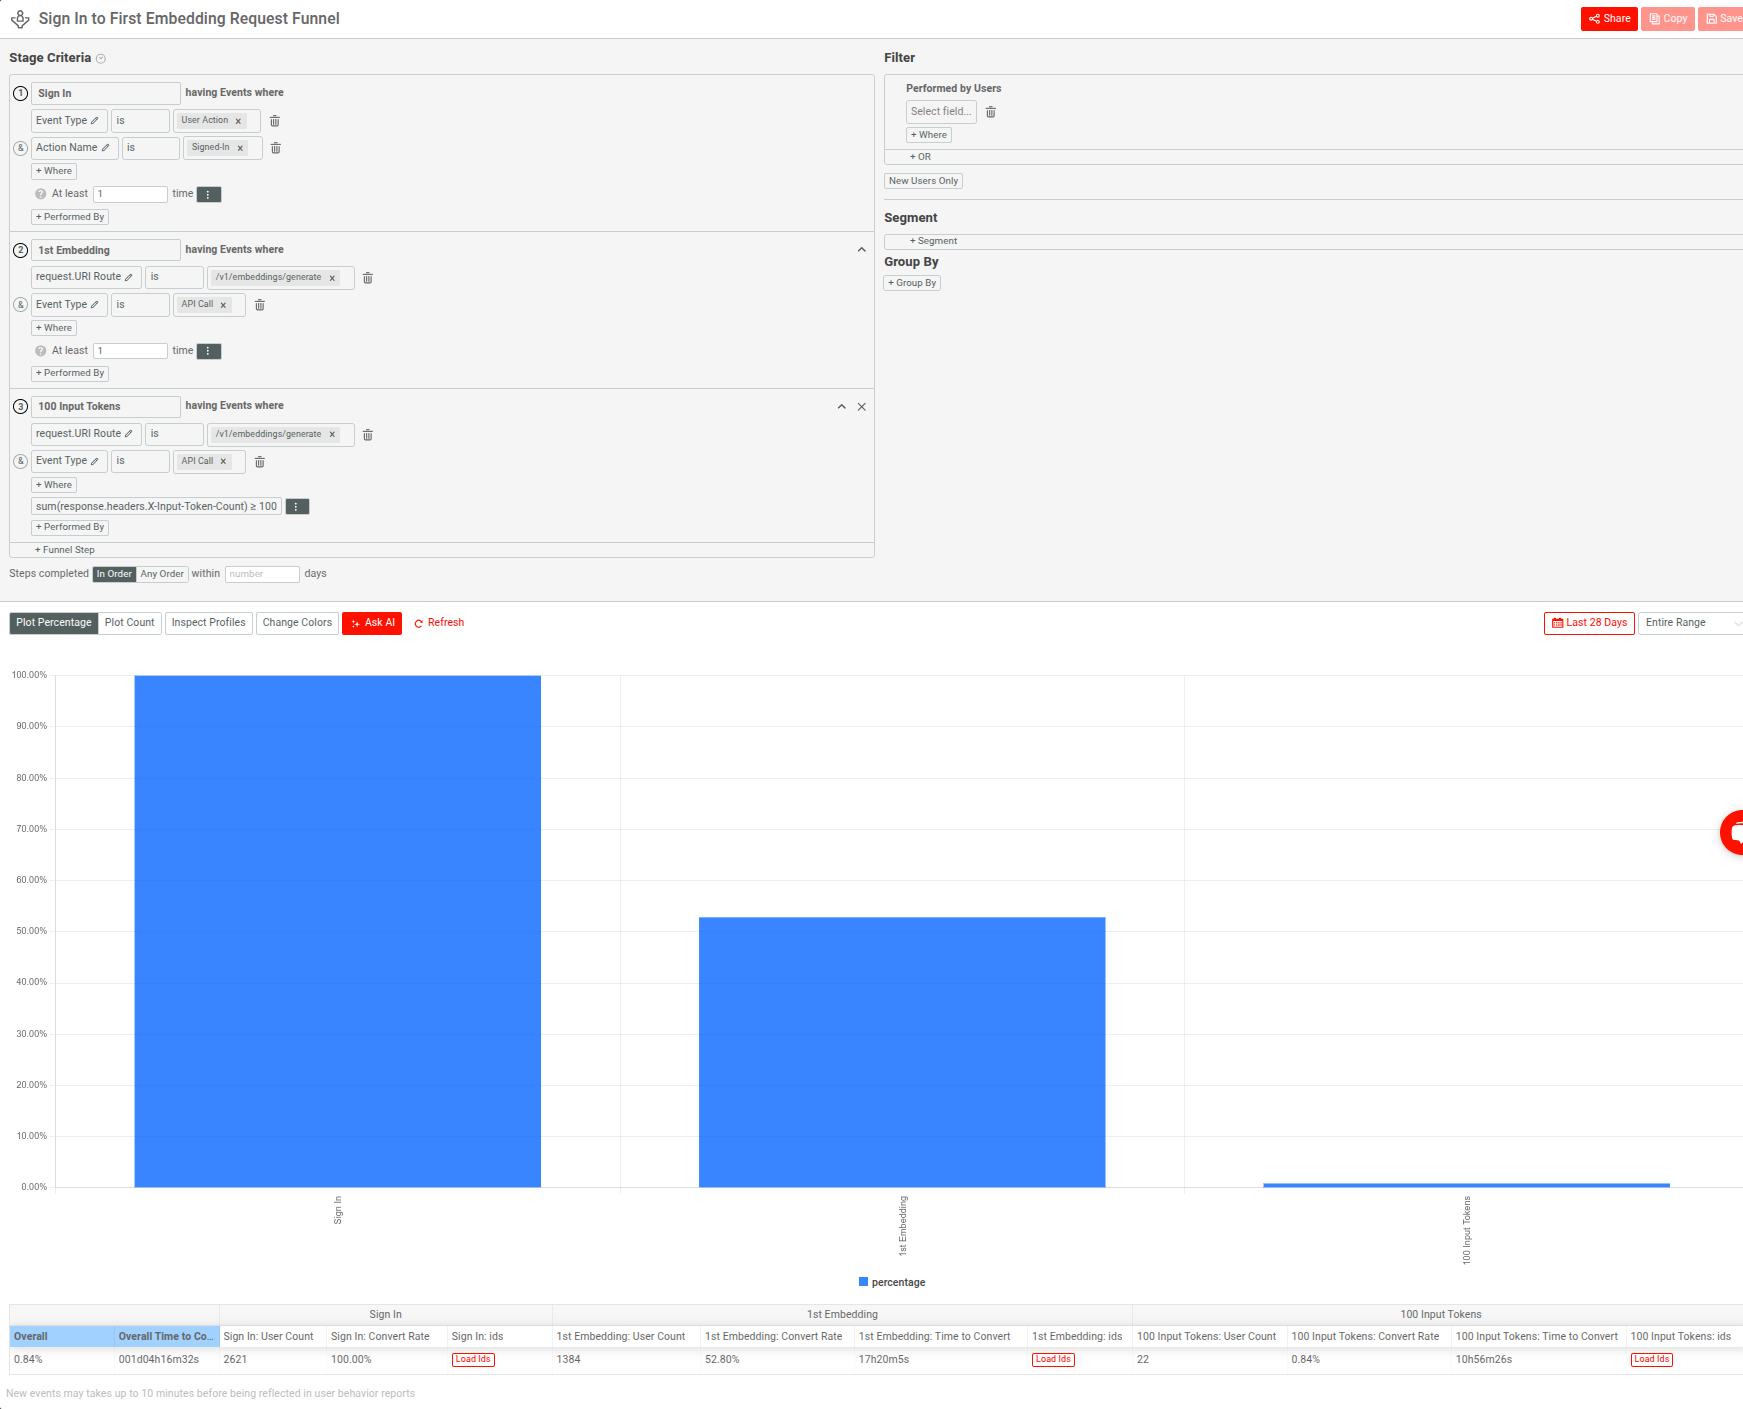
With Moesif’s funnel analytics, you can visualize how many users move through each step. A steep drop-off after step one may reveal frontend bugs, missing environment variables, or incomplete docs. Healthy usage flows through the funnel. Unhealthy usage drops out early, and often silently. Using this feature, you can, for example, catch product-led integration failures before support tickets arrive
The following demonstrates a Moesif funnel that models a typical integration flow in a GenAI API stack:
-
Successful sign-in event
-
First call to the
v1/embeddings/generateendpoint -
Input token usage exceeding 100 tokens

Example: Identifying Misbehaving Clients with Error Heatmaps
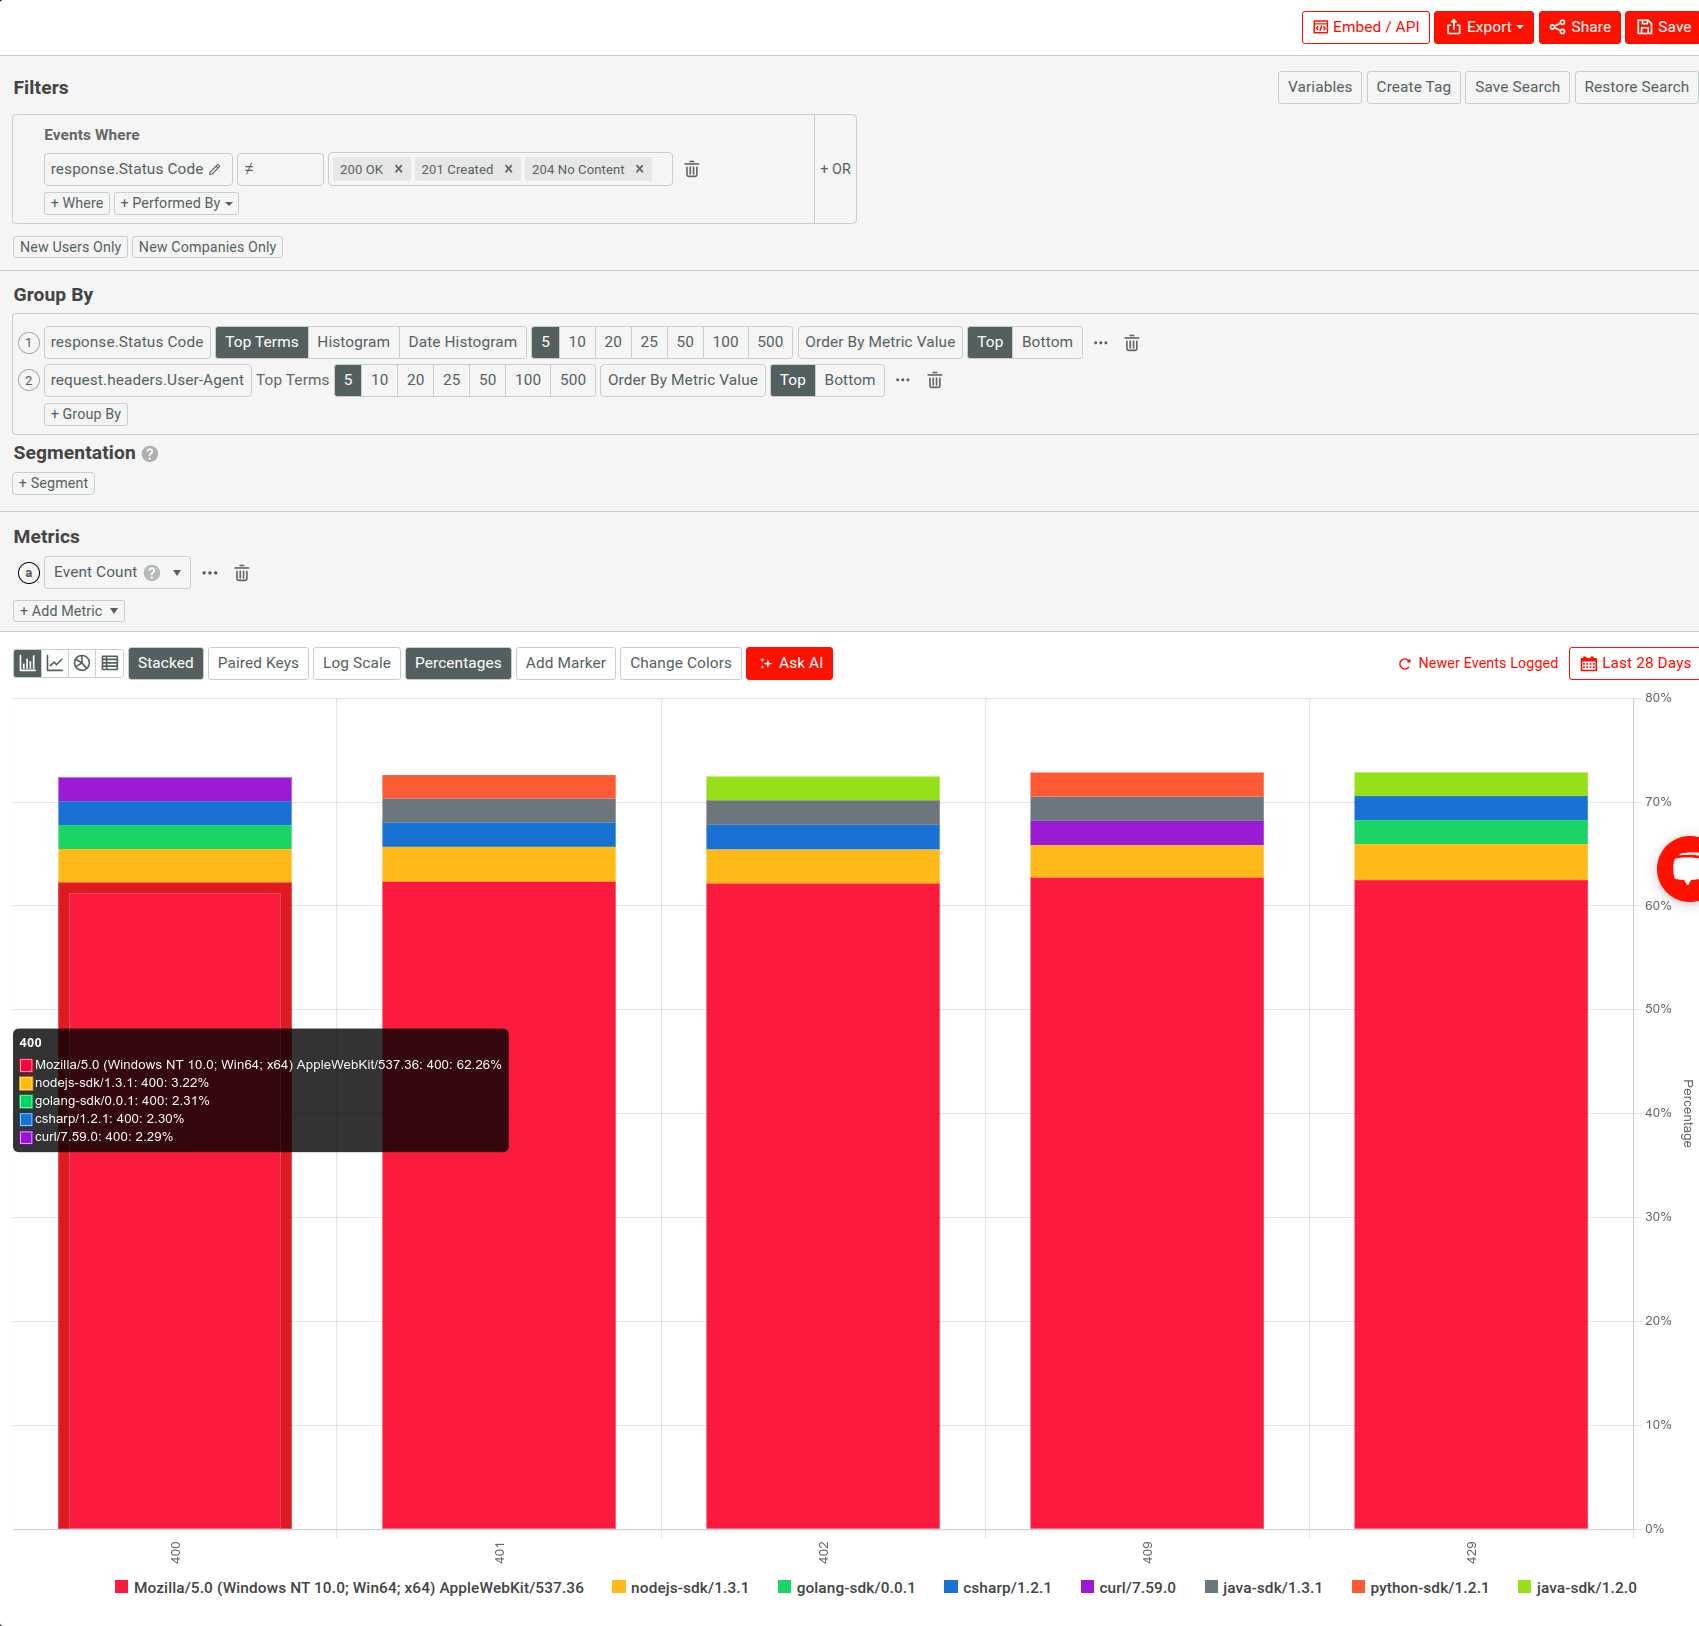
Healthy APIs distribute errors evenly—or better, rarely. With Moesif, you can segment traffic by API key or account to identify clients responsible for a disproportionate number of errors.
For example, an engineering team might use Moesif to identify that a single API client causes a disproportionate number of 422 Unprocessable Entity errors. This can happen if the client sends malformed JSON payloads due to outdated request logic. The backend might remain stable, but the integration clearly breaks—and infra monitoring doesn’t catch it. Moesif helps you triage integrations causing the most friction or wasted compute.
Here’s another illustration using Moesif where we break down API errors by status codes and SDKs in a Segmentation chart, noticing that most of the errors stem from one particular SDK:

Example: Diagnosing Excessive Prompt Token Usage
Suppose you have built a LLM(large language model)-powered chat-based API. You notice that one account is generating significantly higher hosting costs than others. However, your infra metrics show stable response times and no errors.
With Moesif, you can break down usage by API key or account and discover that this account consistently sends massive input payloads—like 20,000+ tokens per call—well beyond typical usage patterns. They’re essentially treating your endpoint as a bulk batch processor, rather than a conversational API.
Having this insight, you can enforce usage guidelines, apply rate-limiting, or update your API documentation to reflect best practices.
This way, you can, for example, spot outlier behavior that inflates cost or degrades performance, even when infra health appears stable.
Account Health from an Engineering Lens
Engineering teams often think of “health” in terms of system uptime, error budgets, or incident response. However, for API-first products, account health becomes just as much a technical concern as it is a business metric. A customer account can be healthy from a CRM perspective while actively failing at the integration layer—and if engineers can’t see that, no amount of uptime will prevent churn.
From an engineering standpoint, account health means the following about the systems interacting with your API:
-
Behave predictably
-
Perform within acceptable error and latency thresholds
-
Follow your expected integration patterns
Moesif lets you define health by whether an account makes requests as well as how those requests behave over time.
One signal of poor health is sustained high error rates from a single account, even if the errors don’t affect infrastructure. A partner integration that consistently sends invalid payloads or calls deprecated endpoints may look like usage from a distance—but in reality, they’re burning cycles and failing silently. Engineering teams must monitor error composition and frequency segmented by account, not just endpoint or region.
Another signal is sudden drops in API volume from historically active accounts. This may indicate an internal service failure, a misconfigured deployment, or an upstream breaking change in the customer’s stack. These issues often don’t trigger alerts unless you’re explicitly monitoring volume trends per account. Moesif enables this by letting you visualize usage deltas over time and compare against baselines.
Authentication patterns also serve as indicators of health. If an account frequently receives 401s or token expiration errors, they may be using the API without proper session management. That often leads to unnecessary retries, excessive load, or degraded client experience.
Finally, repeated access to deprecated endpoints is often a lagging indicator of poor API hygiene. If a customer hasn’t migrated off older versions after a deprecation warning, engineering should flag the integration as at-risk. You can set up alerts in Moesif on versioned endpoint usage so you can enforce contract changes without breaking unaware clients.
Debugging and Alerting in Production
Production debugging rarely starts with perfect context. Logs have noises, dashboards show deltas—not causes—and distributed tracing often misses the human or client-side dimension. Moesif gives engineering teams a behavioral lens into production issues by connecting individual API requests to specific users, clients, or accounts. This allows you to trace problems back to who caused them and how.
Debugging with Real-Time Visibility
Moesif’s Live Event Log provides a stream of all API requests and responses. You can enrich them with user IDs, API keys, payload metadata, and more. You can drill into these sessions to perform tasks like the following:
-
Inspect malformed requests without relying on raw logs.
-
Compare expected versus actual payload structure.
-
Spot trends like token expiration loops, missing headers, or invalid auth flows.
You can filter requests by user ID, endpoint, status code, or custom metadata, making it easy to isolate incidents that tie to specific customers or versions. You will find it especially useful during on-call when infra metrics show elevated 4XXs or degraded latencies, but don’t pinpoint the source.
Moesif also captures entire request and response bodies, critical when debugging issues like these:
-
Invalid JSON schema in
POSTpayloads -
Unexpected values downstream systems return
-
Empty or malformed error messages
To protect sensitive data, Moesif supports field-level redaction through functions, so you can preserve visibility while meeting compliance requirements. For example, see the maskContent configuration option in Moesif Node.js middleware documentation.
Configuring Actionable Alerting
Unlike infrastructure alerting system, typically firing on server resource metrics or uptime checks, Moesif lets you create alert rules based on API behavior and client-side signals. For example:
-
Trigger an alert when a specific account hits 100+
401 Unauthorizederrors in an hour. -
Notify engineering when the error rate on a critical API endpoint exceeds 5%.
-
Detect behavioral anomalies like users calling your API from 50+ unique IPs in 15 minutes—often a sign of credential abuse or misconfigured systems
You can define alert conditions in Moesif using combinations of Moesif’s powerful filters, group, and metrics parameters. For example:
-
HTTP status code filters
-
Request volume thresholds
-
Specific endpoint paths or HTTP methods
-
Custom fields like user ID, company ID, or version
Notification Channels that Fit Your Workflow
Moesif integrates with common notification systems and routes them to where you can act on them:
-
Slack—for example, to engineering or on-call channels
-
PagerDuty—for example, for incident escalation
-
Custom webhooks for internal alert routers or ticketing tools
You can create and manage notification channels directly from the Moesif dashboard and associate them with individual alert rules. This allows you to route critical errors to ops, retry failures to backend devs, and auth anomalies to security—all with different sensitivity thresholds.
Leveraging AI to Explain What Goes Wrong
Moesif’s AI Explain can assist engineers during incident response by analyzing filtered request logs and summarizing trends in natural language. For example:
-
“Most
422 Unprocessable Contenterrors in this view are caused by missing the user_id field.” -
“Error rate increased after version
v2.3was rolled out to clients.”
This feature works across API analytics, user behavior, and alert-based data slices, giving engineering teams a faster way to triage production issues—without having to reverse-engineer dashboards under pressure.
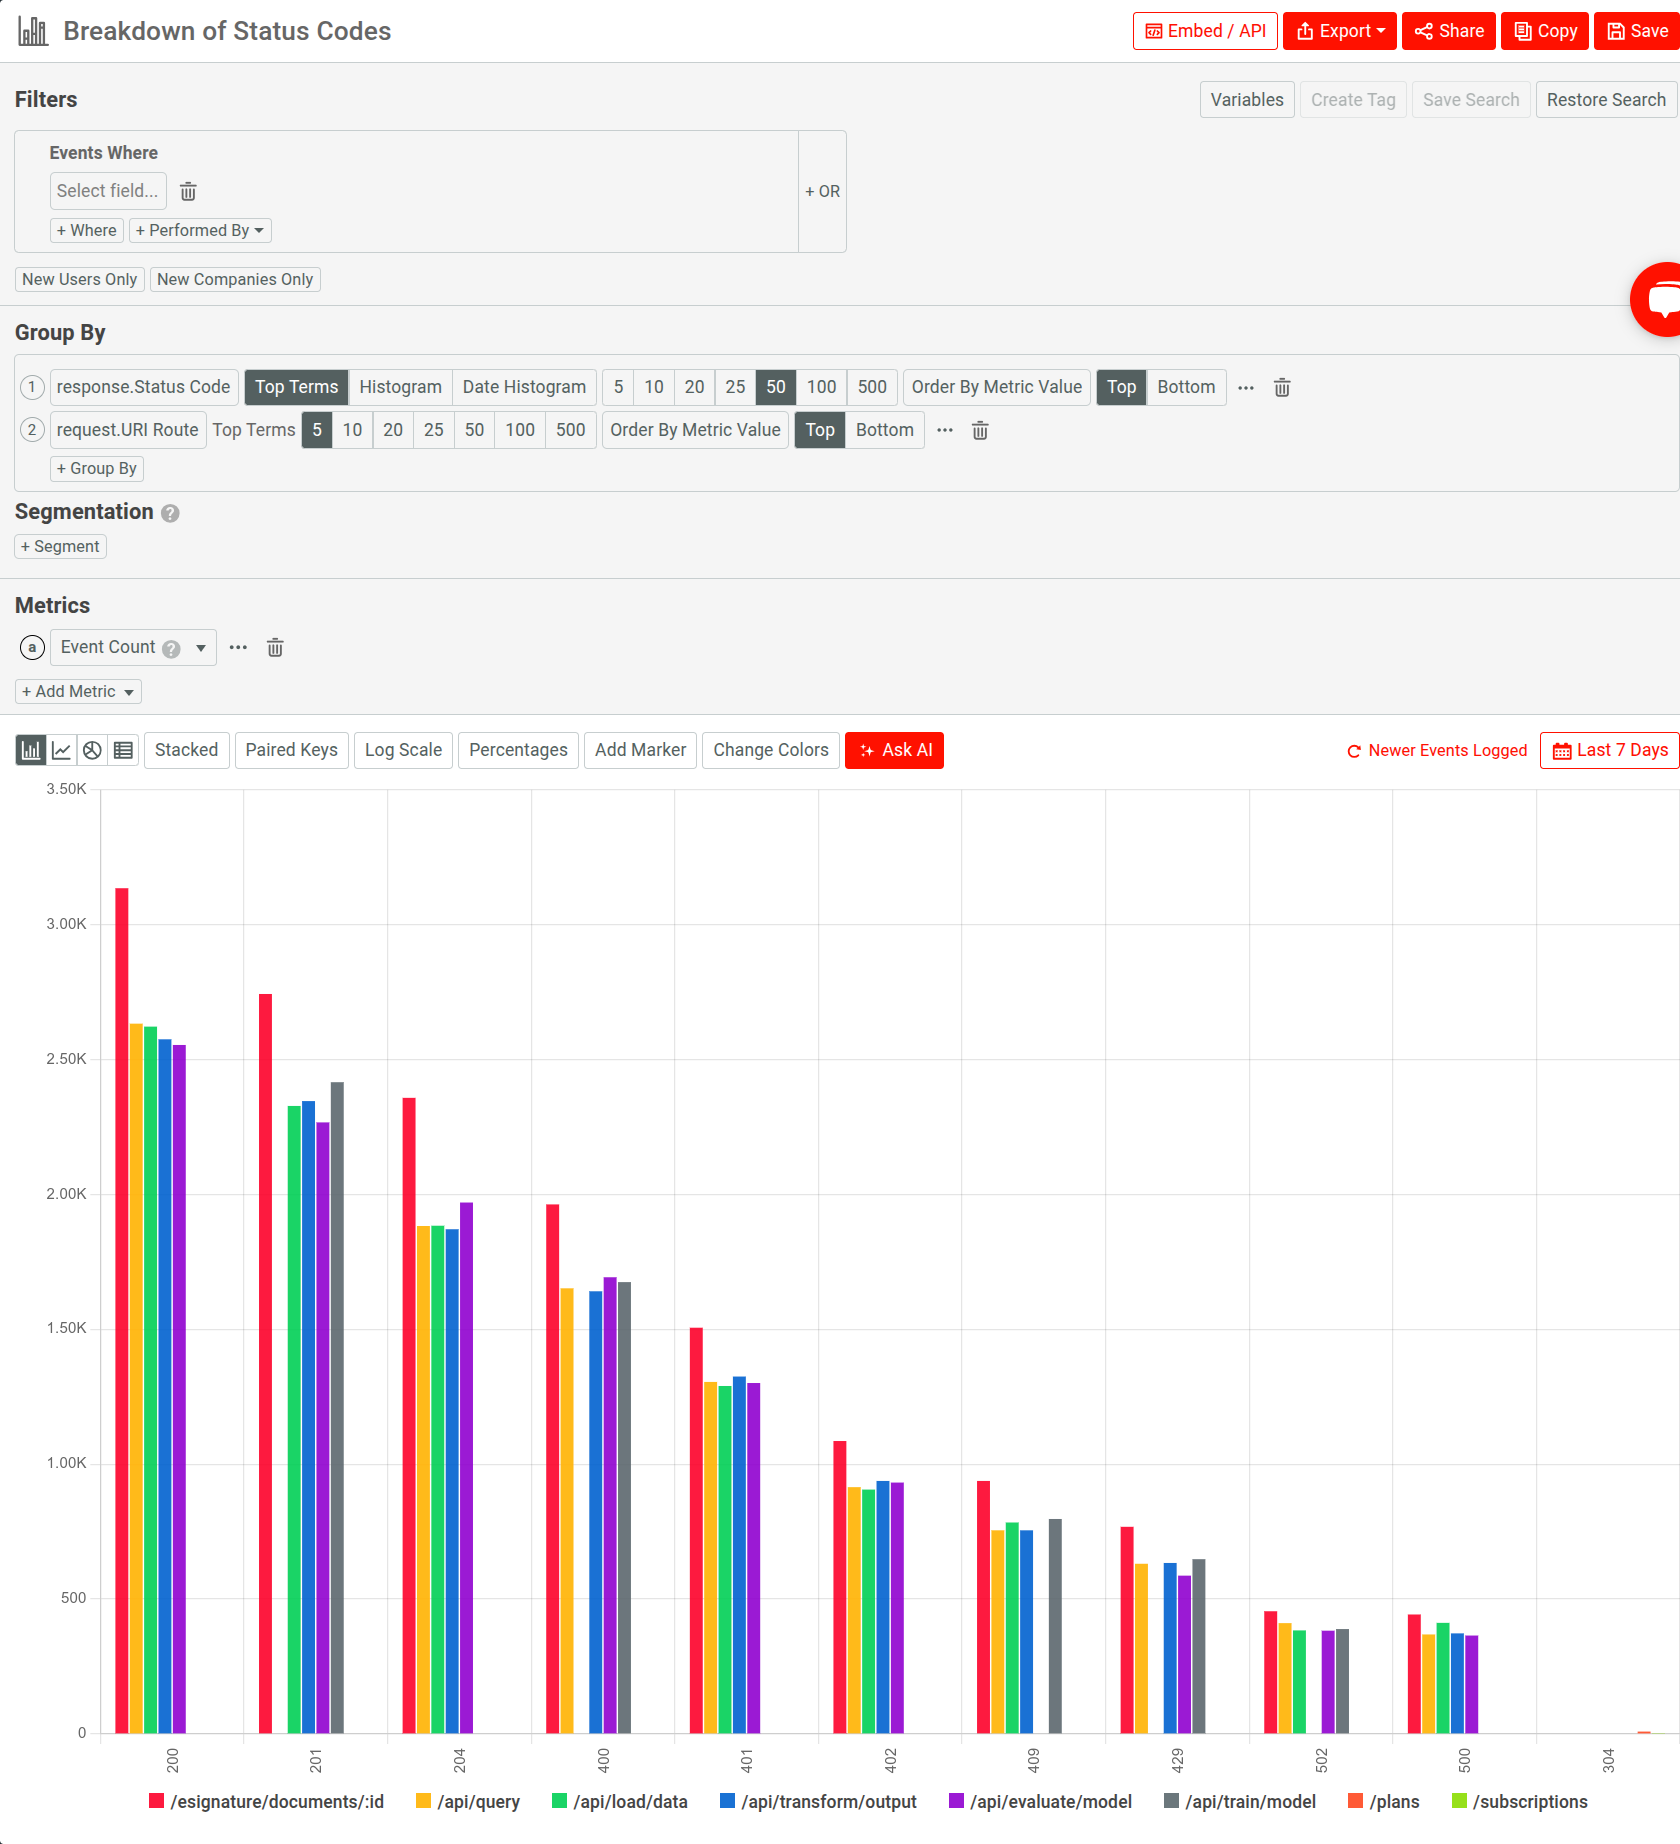
For example, consider a breakdown of HTTP errors across endpoints using a Segmentation analysis:

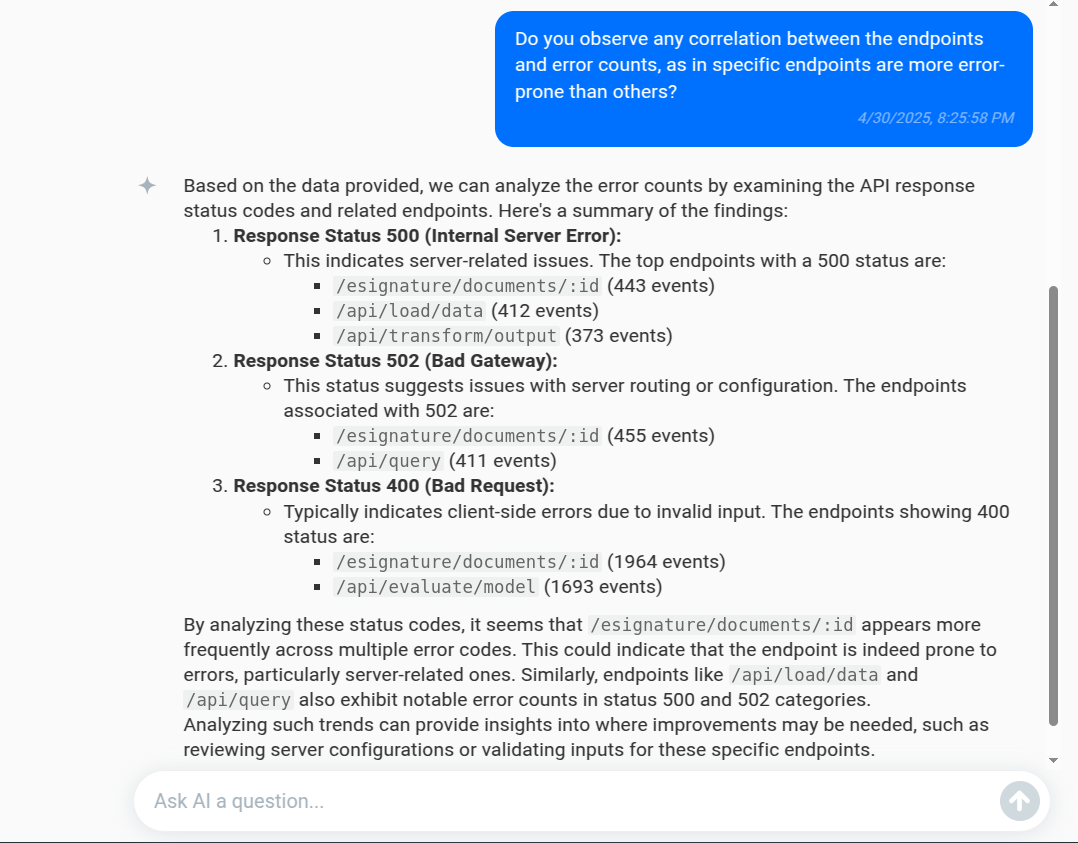
Let’s ask AI Explain the following question to see if some endpoints in the product have been encountering more errors:
Do you observe any correlation between the endpoints and error counts, as in specific endpoints are more error-prone than others?
Here’s how it mind respond:

This way, AI Explain helps you troubleshoot potential issues and initiate investigations more quickly.
Wrapping up
API monitoring encompasses both uptime or error rates and understanding how your systems behave in the hands of real users. Engineering teams need more than dashboards that track availability. They need visibility into integration health, client behavior, and the subtle regressions that precede incidents.
Moesif makes that visibility more accessible. It lets you debug with context, monitor accounts beyond raw traffic, and configure alerting system that reflect actual usage patterns in addition to server metrics.
You don’t need to replace your observability stack. Rather, it’s about covering as much ground as possible. If you’ve ever been stuck debugging in the dark, or found out about a failure from a customer first, you already know what that visibility is worth.


